



Euro Price Outlook: EUR/USD Snaps from Key Resistance - What's Next?
The CPI report didn’t seem to be that far away from the expectation, but the market response so far has been rather large, begging the question as to whether USD strength and EUR/USD weakness are on the way back as dominant themes.
Share this:

Euro, EUR/USD, US Dollar Talking Points:
- EUR/USD tested a spot of confluent resistance earlier today at the 1.0636 level that I had highlighted yesterday, and the response was not pretty for EUR/USD bulls.
- Bulls had an open door to run a short-term breakout this morning after CPI, but they were slammed down as yields began jumping and US Dollar strength re-appeared even despite a largely in-line CPI report.
- This was also a big theme in the Tuesday webinar, and I’ll be talking about this again next Tuesday. To sign up: Click here to register.
Data does not always have a direct and logical impact on market prices. I feel like I’ve said that a lot this week, but after last Friday’s move in the US Dollar the question had started to come up, why the USD was selling-off even despite a previously bullish backdrop and an NFP report that looked to be very strong.
The reason for this unexpected shift is the fact that data doesn’t push prices – buyers and sellers do. And to be sure in many cases those buyers and sellers are responding to data and pricing that in as they receive it; but there are extenuating circumstances, or outlier scenarios, that could complicate that dynamic and in-turn frustrate retail traders. Take the US Dollar, for instance, which coming into last week had risen for 11 consecutive weeks. That’s rare, and it had only happened one other time in the past ten years. And when it did take place in September of 2014, there was a two week break at the end of that streak, with the Greenback continuing to march higher for much of the next six months. It was an extreme trend, and all-told the USD gained more than 25% in that run.
This is markets, and that is but one sample. So, it would be incredibly dangerous to think that that singular scenario would play out the same way. But – it does highlight stress, to see an asset as important as the US Dollar put in such a consistent streak of gains, and to be sure, over the past 12 weeks since that had started several peculiarities have shown. Like a near-parabolic rise in US Treasury rates, or equities beginning to turn over.
It was just a week ago that we had oversold RSI readings on the daily charts of Gold, EUR/USD and SPX, which goes along with that extreme trend that had priced-in with the US Dollar.
So, back to NFP. When that report came out on Friday the USD was already in process of pulling back, as it had set its high on the previous Tuesday. That high point came in at 107.20 and this really seemed to be a case of extreme overbought where the market had gotten so incredibly one-sided that even a positive piece of data would fail to draw fresh bulls into the market.
And that’s what we were looking at in the US Dollar in the early part of this week. Going along with that, EUR/USD had shown stall at the 1.0500 psychological level. I spent a good amount of time talking about this in the webinar the week before, and how something like that could lead into pullback scenarios, so it seemed sensible that an oversold trend might pullback. And then on NFP Friday, EUR/USD held a higher-low and the pullback move continued to price-in this week.
Coming into the CPI release this morning, EUR/USD had held a confluent spot of resistance on the chart. The 1.0636 level was of note as this was the low during the pandemic theme in March of 2020, and then came back as support on May 31 of this year. For this morning, that price was also confluent with a bearish trendline that’s held the highs in the pair since July.
EUR/USD Weekly Chart
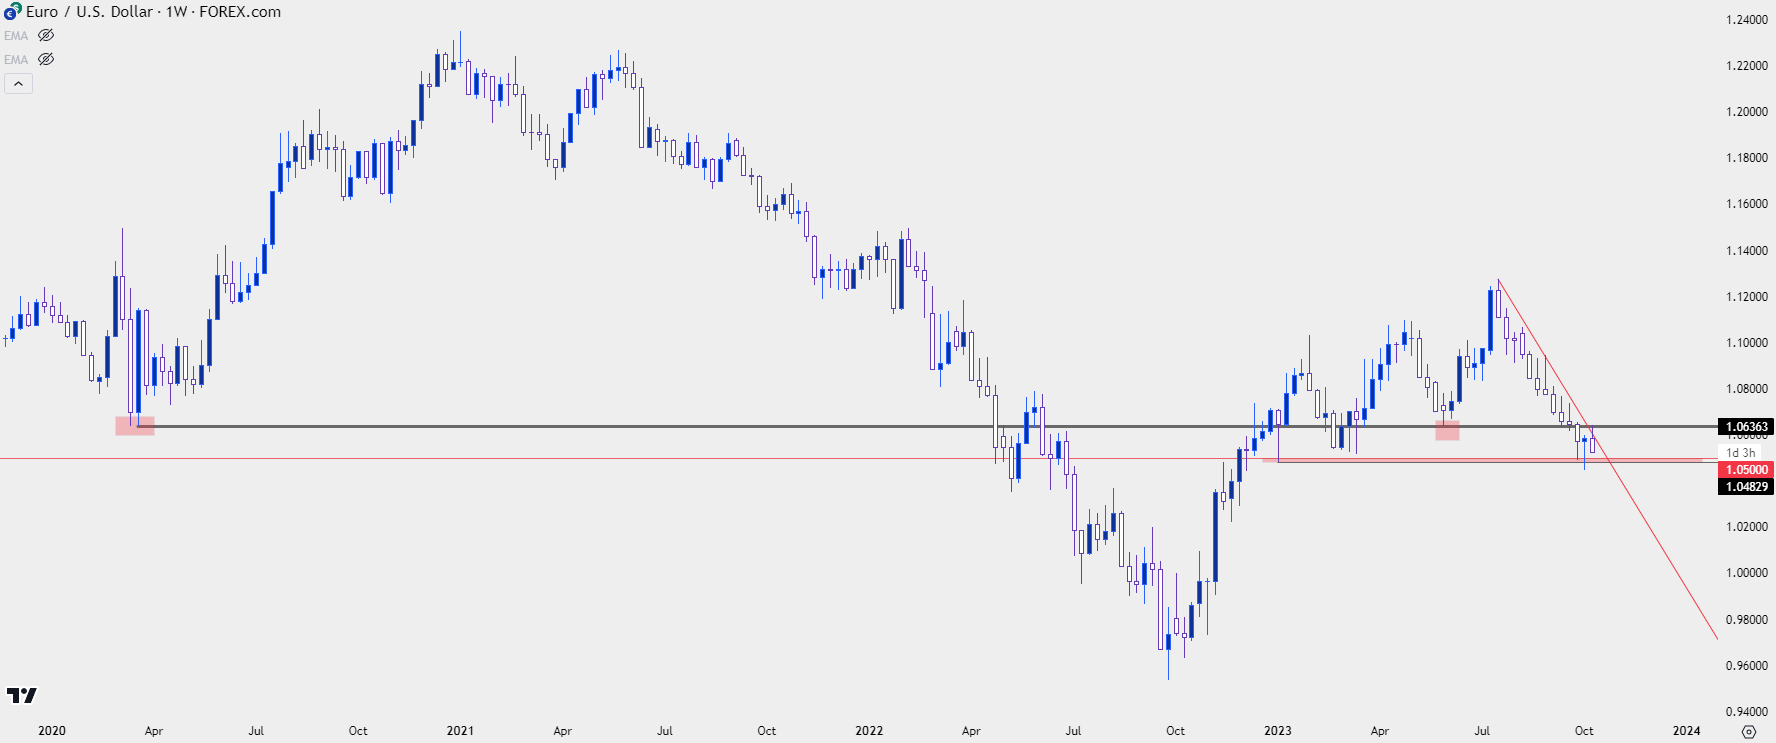 Chart prepared by James Stanley, EUR/USD on Tradingview
From the weekly chart above, you can probably see another item of note and that’s the support at 1.0500.
This has become an important item in EUR/USD so far this year as that zone around 1.0500 was in-play as support in the first week of the year. And it didn’t come back into the picture again until a couple of weeks ago, when it first helped to set a bounce and then was traded through last week. But that’s where sellers began to slow as price was wedged below the big figure and the pair had difficulty drawing fresh sellers into the matter to further drive the trend.
That’s what helped to open the door to pullback, which first started with stall, and then led to a bounce as prices worked their way up to test resistance at prior support. Even into yesterday, bulls retained potential as prices had shown higher-highs and higher-lows. But given the response that we’re seeing today the question has to be asked whether bears are in position to put in a lasting break below the 1.0500 handle.
From the daily chart below, we can see how forceful that move has been so far, as the day’s range has already eclipsed 100 pips.
EUR/USD Daily Price Chart
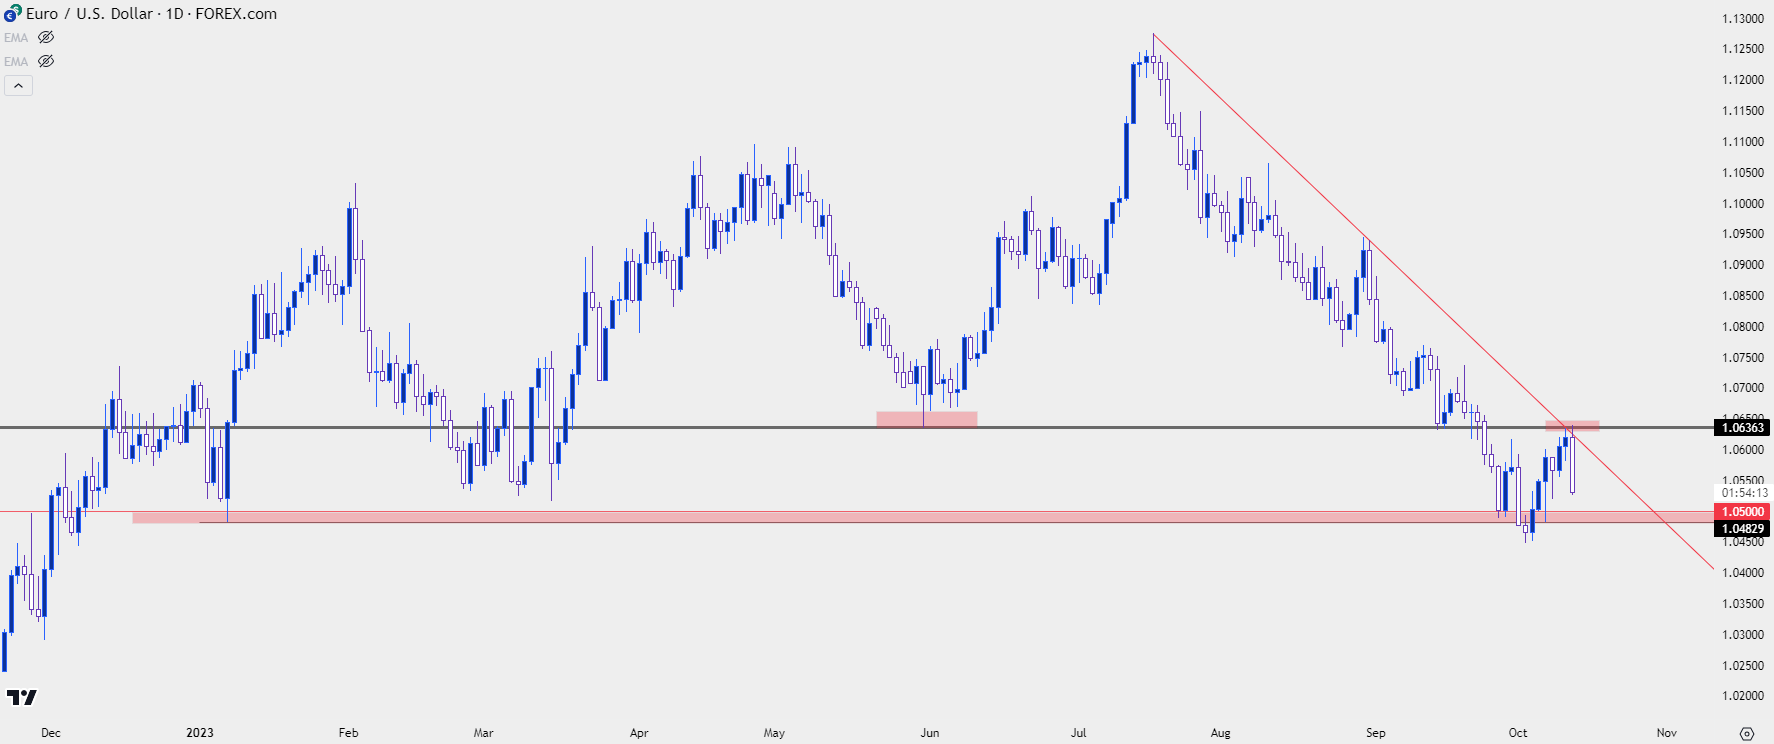 Chart prepared by James Stanley, EUR/USD on Tradingview
EUR/USD Strategy
Trends, support and resistance and sentiment all play important roles to the trader. The sentiment part, well we touched on that to start this article, as this helps to explain why data doesn’t always price-in how one might want or think that it should. Support and resistance are important for a number of reasons, key of which is risk management.
But trends, trends are important because the future is uncertain. Trends exist, and often for a reason, and when one is identified it’s something that can be incorporated into strategy. The trend might continue, and this can allow the trader to implement if-then statements that can enable risk management to be a part of the decision-making process. And support and resistance will probably be a part of that, too.
The problem that we have here is that the trend in EUR/USD and the trend in the USD is still very near those swing support lows around the 1.0500 handle. We only had a week of pullback in the USD and EUR/USD was only able to retrace about 23.6% of that prior sell-off. So was that enough to allow for bearish trend continuation? Or is this merely setting a trap, where sellers supply dries up as we get closer to or below the 1.0500 handle.
The concern would be a still oversold-like backdrop on a recurrent test below the 1.0500 level. Psychological levels are key points of support or resistance because they have the potential to change human behavior (hence the term, ‘psychological’); and this is what can help to mold bottoms or support, such as we saw in EUR/USD last week.
So, the question here is whether the trend will be so strong that it can drive below 1.0500 and continue to break down. For this to happen the pair would likely need to attract more sellers and perhaps this morning’s CPI report is enough to accomplish that aim. Nonetheless, chasing can be dangerous as the move has already put in a strong push lower.
This could, however, highlight possible resistance levels to use to work with lower-highs in the event that trend continuation does continue to show. From the four-hour chart below, the same 1.0611-1.0636 zone remains overhead. Along the way, there was a short-term swing at 1.0582, which I’m connecting to the Fibonacci level at 1.0568 to create another zone that could be tracked for more aggressive stances.
EUR/USD Four-Hour Price Chart
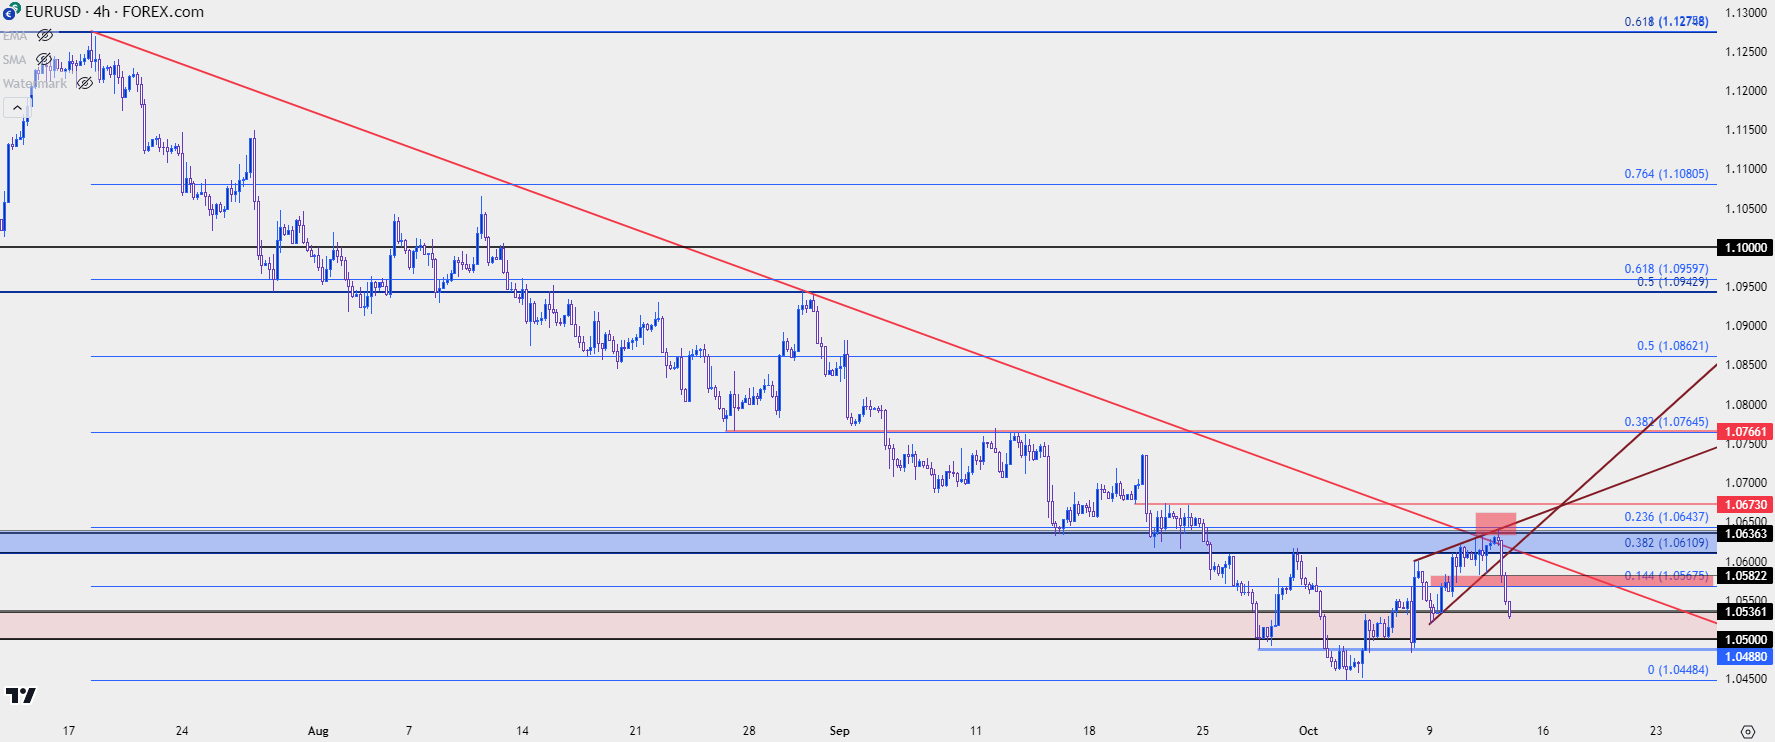 Chart prepared by James Stanley, EUR/USD on Tradingview
Going a bit more short-term, I’m looking at the two-hour chart below. The complication for bears remains support, as there was a build of higher lows before the pullback started to run, and each of those points are possible points of entries for bulls, or areas where the bearish momentum may go awry.
The support levels on the way to fresh lows are at 1.0520, 1.0500, 1.0488 and then the current 2023 low at 1.0448. If bears can test through that last level, there’s a confluent spot around 1.0350 that remains of interest for longer-term scenarios in the pair.
EUR/USD Two-Hour Price Chart
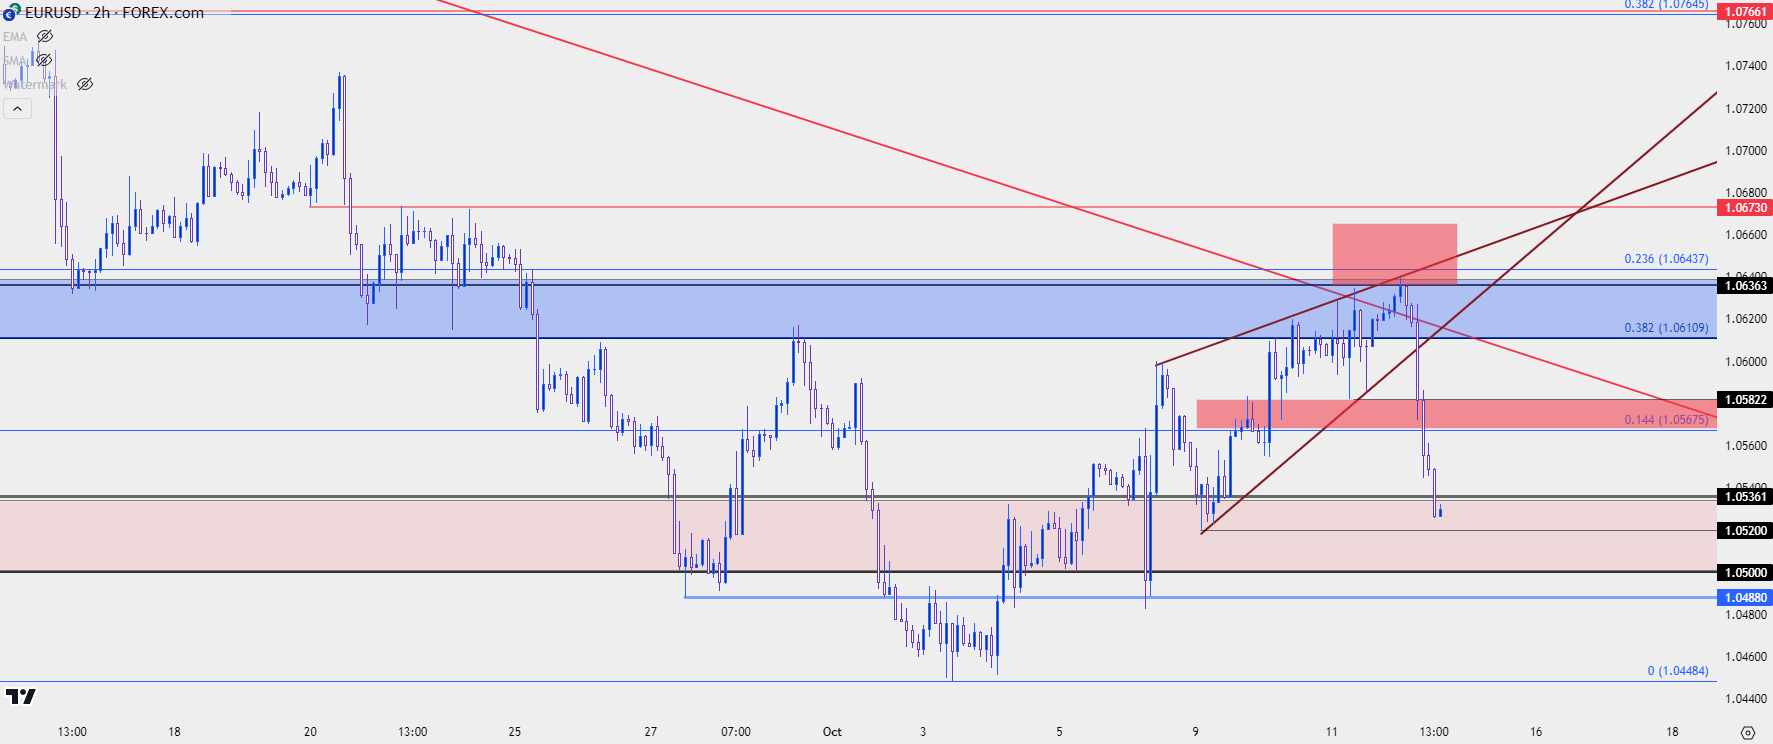 Chart prepared by James Stanley, EUR/USD on Tradingview
--- written by James Stanley, Senior Strategist
Related tags:

Open an account in minutes
Experience award-winning platforms with fast and secure execution, and enjoy tight spreads from 0.5 pts on FX and 0.3 pts on indices.
Economic calendar
Web Trader platform
Our sophisticated web-based platform is packed with features.
Related articles

USD/JPY falters, EUR/USD awaits French bond verdict
The yen has reacted to falling US yields, but the euro faces a different problem. Could French government bond yields provide the additional push needed to break EUR/USD's downtrend?

Gold Bears Approach Major Support, USD/CHF Eyes Reversal
Gold bears approach major support around $4,000, while USD/CHF shows signs of a bearish reversal. Middle East tensions add to market uncertainty.


EUR/USD Forecast: Euro Remains Under Pressure Amid Concerns Over French Debt
Recent trading sessions continue to present a challenging environment for the euro in the short term. This can be seen in the performance of EUR/USD, which has declined by approximately 0.5%, reflecting another loss of ground for the European currency and highlighting the continued strength of the U.S. dollar.

This report is intended for general circulation only. It should not be construed as a recommendation, or an offer (or solicitation of an offer) to buy or sell any financial products. The information provided does not take into account your specific investment objectives, financial situation or particular needs. Before you act on any recommendation that may be contained in this report, independent advice ought to be sought from a financial adviser regarding the suitability of the investment product, taking into account your specific investment objectives, financial situation or particular needs.
StoneX Financial Pte. Ltd., may distribute reports produced by its respective foreign entities or affiliates within the StoneX group of companies or third parties pursuant to an arrangement under Regulation 32C of the Financial Advisers Regulations. Where the report is distributed to a person in Singapore who is not an accredited investor, expert investor or an institutional investor (as defined in the Securities Futures Act), StoneX Financial Pte. Ltd. accepts legal responsibility to such persons for the contents of the report only to the extent required by law. Singapore recipients should contact StoneX Financial Pte. Ltd. at 6826 9988 for matters arising from, or in connection with the report.
In the case of all other recipients of this report, to the extent permitted by applicable laws and regulations neither StoneX Financial Pte. Ltd. nor its associated companies will be responsible or liable for any loss or damage incurred arising out of, or in connection with, any use of the information contained in this report and all such liability is hereby expressly disclaimed. No representation or warranty is made, express or implied, that the content of this report is complete or accurate.
StoneX Financial Pte. Ltd. is not under any obligation to update this report.
Trading CFDs carries a high level of risk that may not be suitable for some investors. Consider your investment objectives, level of experience, financial resources, risk appetite and other relevant circumstances carefully. The possibility exists that you could lose some or all of your investments, including your initial deposits. If in doubt, please seek independent expert advice. Visit www.forex.com/en-sg/terms-and-policies for the complete Risk Disclosure Statement.