


Euro Weekly Forecast: EUR/USD Dawdles At Lows Despite Daily RSI Oversold
Despite a deep oversold read bulls didn’t exactly come screaming back into the EUR/USD market, although a series of higher-lows may be an early warning that a turning point may be near.
Share this:

Euro, EUR/USD Talking Points:
- The yield ramp in France brought worries around the single currency last week and that restrained reversal strategies despite deep oversold readings from the week before.
- Last week opened with a violent move but the rest of the week brought higher-lows. This illustrates just how stretched that short-side move is and if a catalyst does appear, that can lead to a quick squeeze scenario.
- On the other side of the matter, with bulls not yet showing enough interest to spark a move, a show of capitulation could lead to reversal scenarios, and I spoke about that in the Tuesday webinar.
It’s been a brutal five-week stretch for the Euro and while US Treasury yields have flown to fresh multi-decade highs, it’s the run in French yields that’s perhaps presented even more concern, even despite French yields being inside of US rates. The issue isn’t an unfamiliar one as it strikes the same chord that presented issues with the sovereign debt crisis now almost 15 years ago, and this speaks to the experiment of a supra-national currency representing a very wide swath of economies that don’t have shared budgets or debts. And, at its core, it speaks to the viability of that currency.
If you look at the monthly chart of EUR/USD and you take a long-ter perspective, that issue is pretty clear. When the Euro came online in 1999, it represented hope that another global reserve currency could help to take some pressure off of the US Dollar. As a solo global reserve, an incredible amount of stress was behind the greenback and this led to episodes like the run-up in the early 80’s followed by the Plaza Accord in 1985, which then brought significant USD weakness that greatly helped the US economy, but hindered many others. Japan’s lost decades, for instance, can be drawn back to that, as the Yen strengthened from above 250 to below 80 and when you have that much currency strength, it’s simply impossible to be competitive on a trade basis. Your products are now that much more expensive overseas and imports are cheaper, making it more difficult for your own companies to do business in your own economy.
Ideally, currencies present a state of balance and if there are trends, they’re slow, as that allows for adjustments with governments gaining enough flexibility to react and respond as needed. But when that’s not there, well, economic performance is largely just one big currency trade.
As the Euro came online in 1999 we saw a considerable amount of diversification from global central banks or multi-national corporations. The currency went from a low of 0.8229 in 2000 to a high of 1.6038 in 2008 largely on the back of that theme. It represented hope that the world might be able to strike a greater form of balance. And while fearmongering often populates around lessened USD usage, the reality is that hope was defined by the prospect of diversification of some of that reserve allocation into the Euro.
But you don’t define reality by only the good times, and it’s during times of stress that you find out what something is made of. The Financial Collapse in 2008 showed a clear flight to quality where global investors eschewed the Euro, and flowed into the USD. And from that initial spark set off a series of lower-highs that built for the next four years, until something else reared its ugly head.
EUR/USD Monthly Chart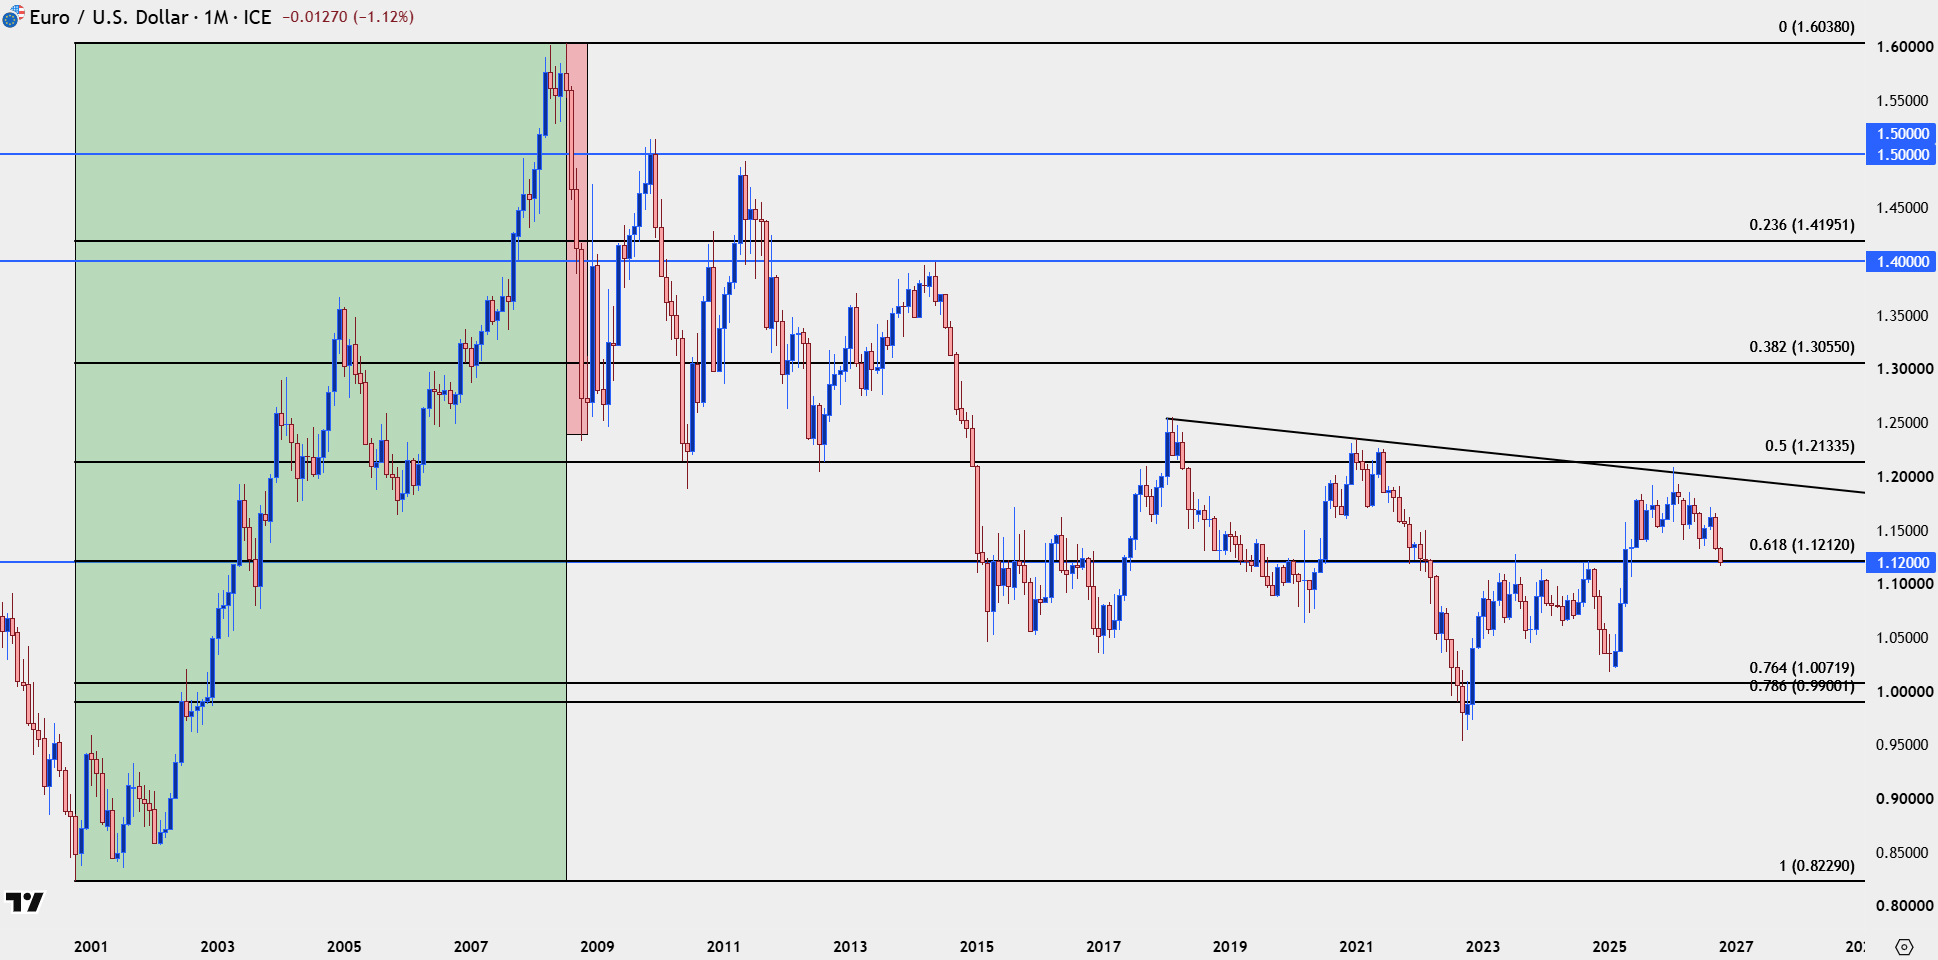
Chart prepared by James Stanley; data derived from Tradingview
Stress Exposes Weaknesses
With the onset of the global financial collapse a degree of bifurcation showed in Europe, and this exposed a problem that was always there but, perhaps, was just glossed over by all of that hope and goodwill. And that problem is the fact that currency is an important part of economic performance and before the Euro, when the continent was represented by a random swath of currencies, economies like Greece or Portugal had an extra element of control that simply did not exist under the Euro.
The shared currency also meant that monetary policy would be shoe-horned regardless of that individual economy’s needs and, frankly, the economies in Europe were so different that it was impossible to create one policy to satisfy everyone. This just further exposes those fractures and by the time we get into 2010, there’s a very real question of European viability behind the single currency. This was noted as the PIIGS of Europe as it was countries in Portugal, Ireland, Italy, Greece and Spain that all presented debt concerns.
Given the lack of history behind supra-national currencies there simply was no playbook for how the situation would go down, and from that dearth of history a host of anxiety built. This came to a head when the ECB President at the time, Mario Draghi, had his ‘whatever it takes’ moment in July of 2012. He scuttled the idea that the Euro would or could be unwound. And that helped to bring back a bit of confidence and as we saw some short bets close out, we also saw some buyers come back in. This time, the pair topped right around the 1.4000 handle, before another significant sell-off began.
EUR/USD Monthly Chart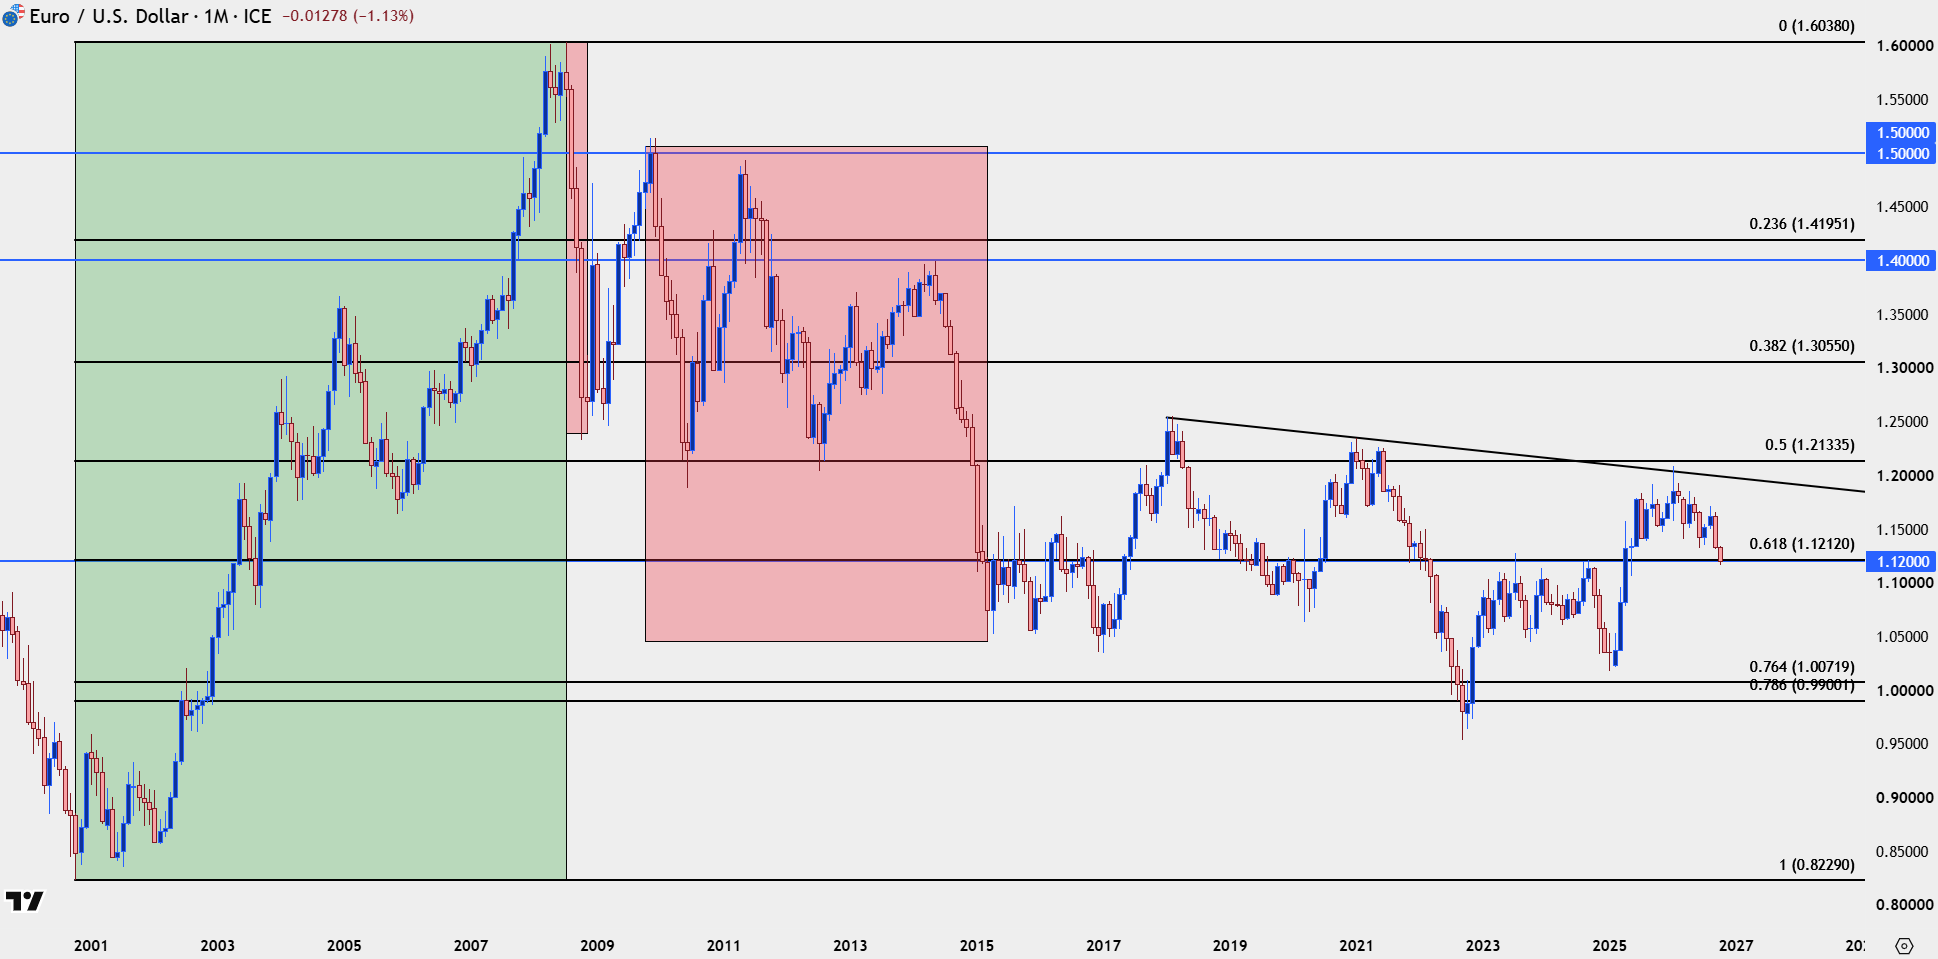
Chart prepared by James Stanley; data derived from Tradingview
In the years since, that hope around the Euro has really faded to a great degree. But, on the same token, there hasn’t been much concern about the single currency going away or blowing up as there wasn’t significant reason for it, even despite some geopolitical stressors around items like immigration or political volatility swinging into more extremes in some particular areas of the continent. Until recently, at least, as French bond yields have jumped to go along with a global bond rout.
This time, however, unlike back in 2012, the ECB President doesn’t seem to be too concerned and this is perhaps due to the past decade or so of moderation. After all, support in the pair right now was resistance back in 2015, around the 1.1200 level.
But with a US seemingly willing to ignore the motivation to create and build the Euro as a USD hedge combined with a European Central Bank that’s not overly concerned about the carnage showing in European bond markets, investors have been selling the currency and there hasn’t been much significant reason for them to stop.
From the weekly chart, we can see the EUR/USD pair testing a major level at the 1.1212 spot, which is the 61.8% retracement of the lifetime move in the pair, and as noted above, this was resistance back in 2015 through 2017.
EUR/USD Weekly Price Chart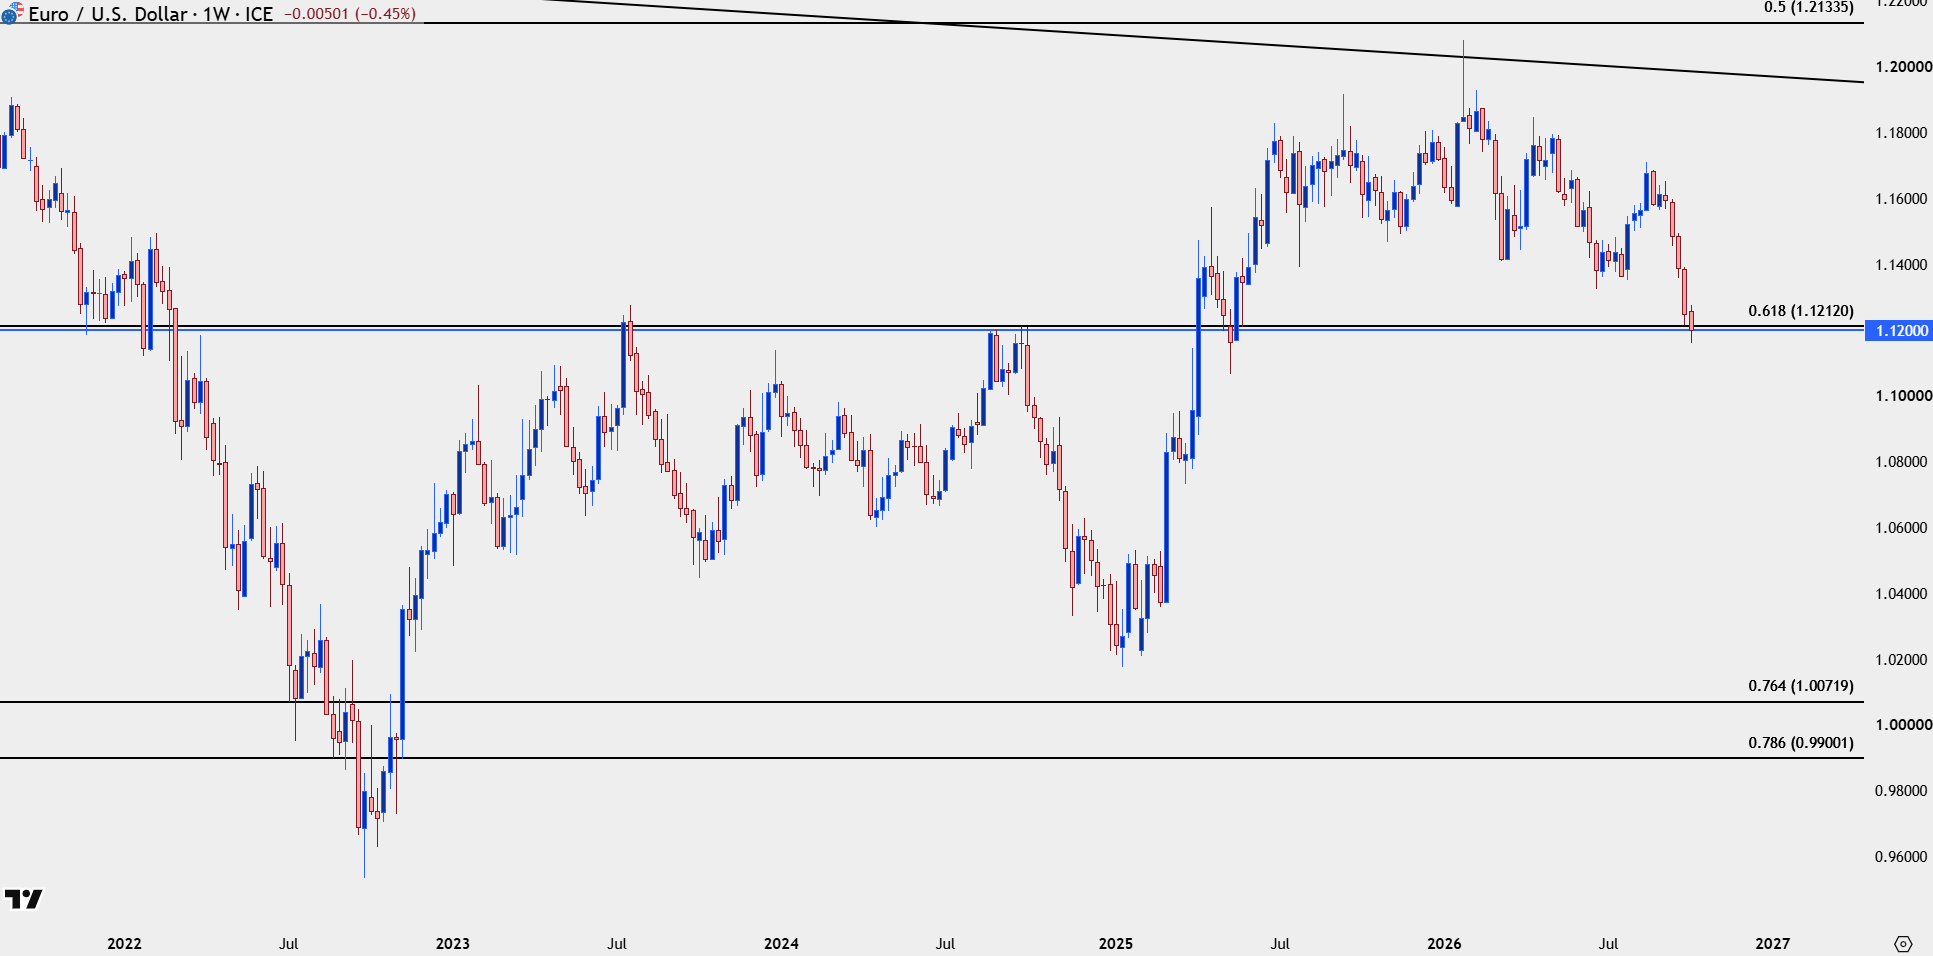
Chart prepared by James Stanley; data derived from Tradingview
EUR/USD – Where’s the Trade?
While the above story is compelling and interesting and speaks to the history of the matter, the fact is that may not be what anyone is trading next week. While it’s certainly possible that there is a larger meltdown in the single currency and that we see EUR/USD plunge to a 1.1000 or 1.0500, the fact is that sell-off stalled over the last week, and the more attractive look might actually be for a rally.
Now, whether that rally is the start of a fresh bullish trend is another matter entirely, but given how oversold the move has become, combined with the fact that sellers failed to push through the low that printed early last week, that just illustrates how much fear – likely driven by the above story – is already priced-in here.
And when you have a heavily shorted market, that means that there’s probably a lot of stops sitting above resistance points, and that can fast turn into a short squeeze situation.
EUR/USD Daily Chart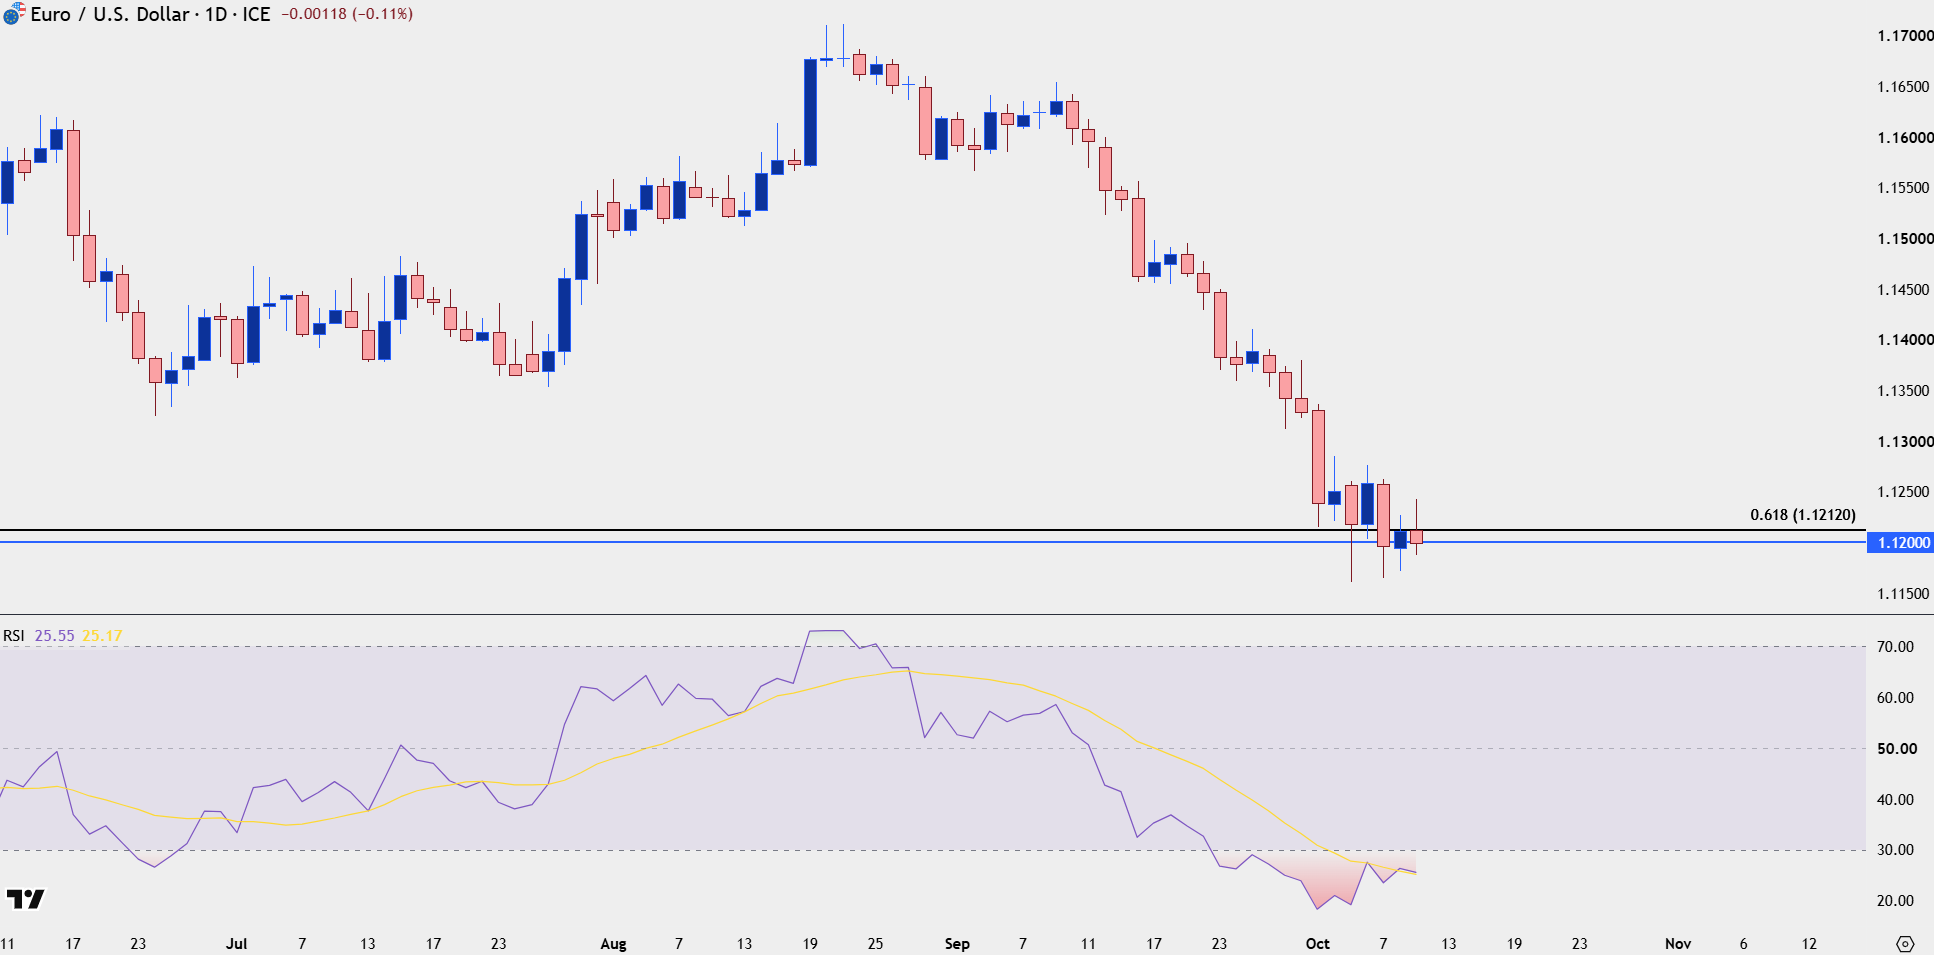
Chart prepared by James Stanley; data derived from Tradingview
EUR/USD Shorter-Term Levels
At this point, we simply have a lessened negative in the deduction of higher-lows. We don’t yet have a ‘positive’ for longs with any significant higher-highs and that is the next step for those looking at reversal scenarios. On the below chart, I’ve highlighted a couple of nearby key levels, with swings at 1.1243, 1.1265 and then 1.1285 standing out. If bulls can force a move above all three of those prices, the prospect of bullish reversal brightens significantly.
However – if we do see another violent open on Sunday which is certainly possible given how anxious bond markets have been, the bigger question is whether we see a degree of capitulation, like we did in the prior week, as sellers fail to run with the fresh low. If we end the Monday candle with an exposed underside wick, and prices closing above a level like the 1.1200 handle, then that reversal prospect can similarly show as attractive.
EUR/USD Four-Hour Price Chart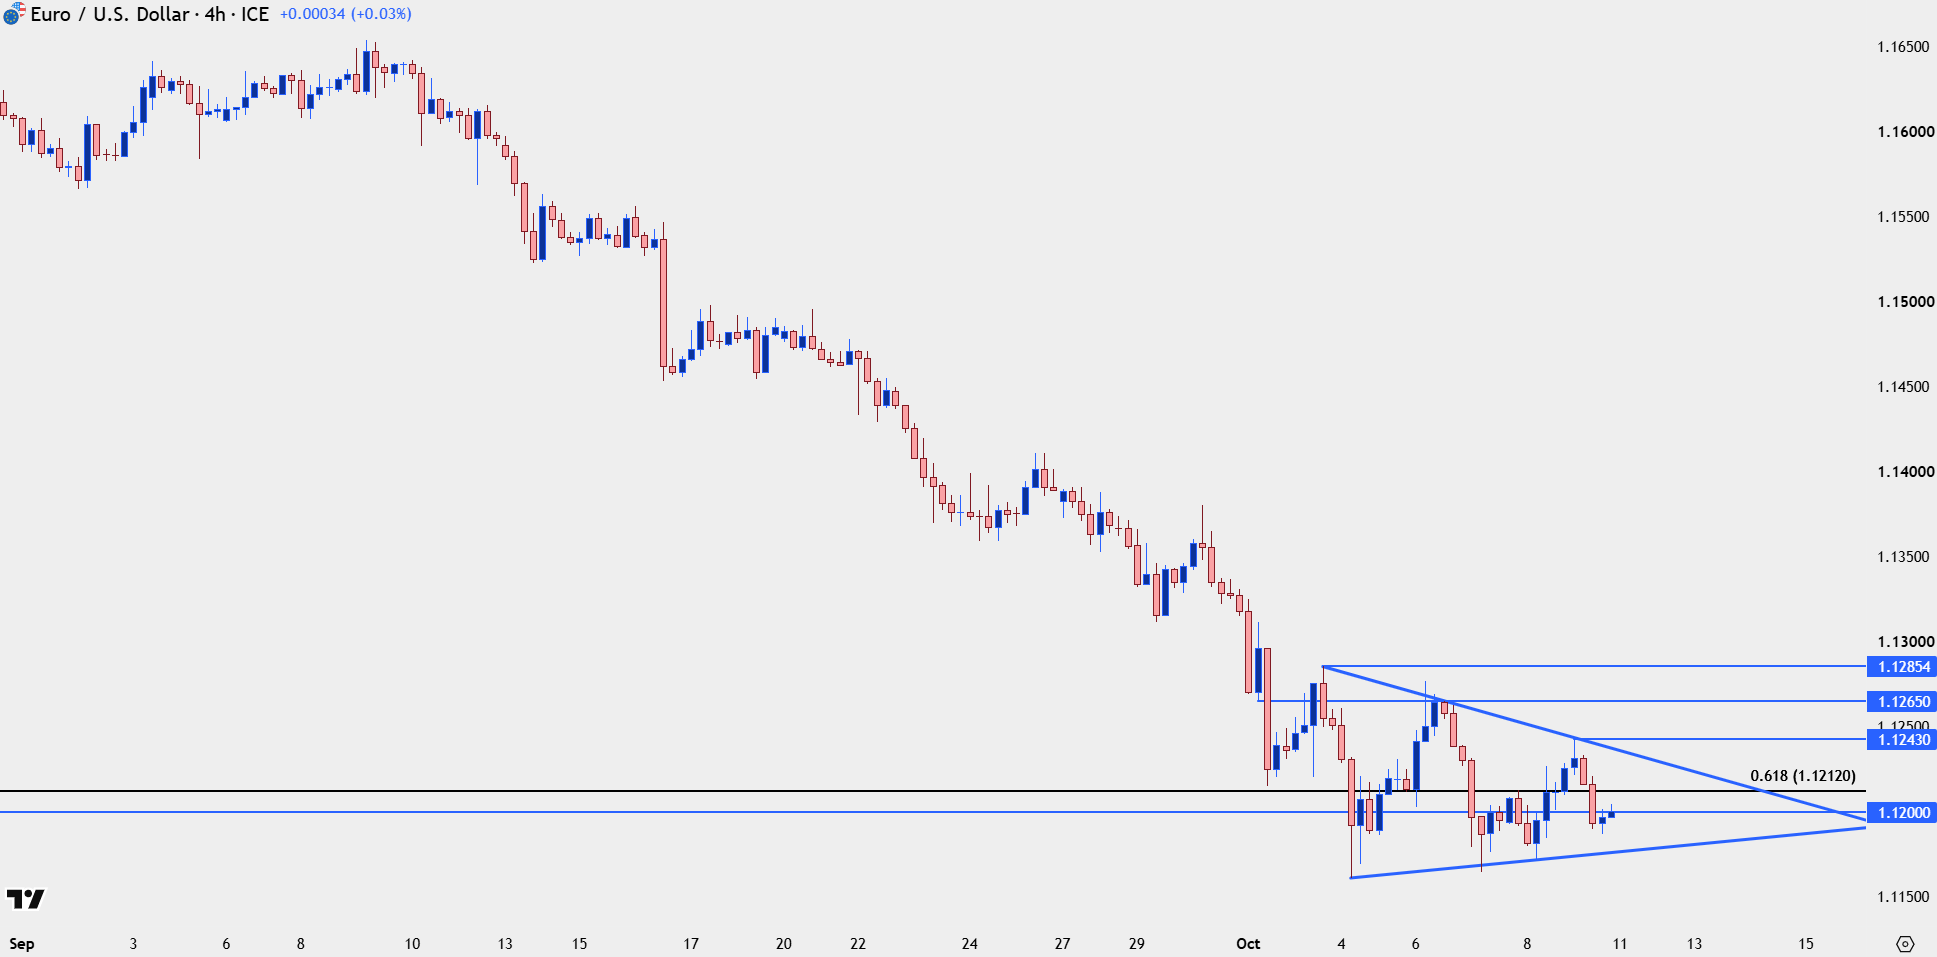
Chart prepared by James Stanley; data derived from Tradingview
--- written by James Stanley, Senior Market Analyst, Global Macro
Latest market news




Open an account in minutes
Experience award-winning platforms with fast and secure execution, and enjoy tight spreads from 0.5 pts on FX and 0.3 pts on indices.
Economic calendar
Web Trader platform
Our sophisticated web-based platform is packed with features.
Related articles
Euro Weekly Forecast: EUR/USD Dawdles At Lows Despite Daily RSI Oversold
Despite a deep oversold read bulls didn’t exactly come screaming back into the EUR/USD market, although a series of higher-lows may be an early warning that a turning point may be near.
Gold Price Forecast: XAU/USD Rebounds as Bulls Defend Critical Support 10 10 2026
Gold has bounced from a major inflection zone, but bulls still need follow-through as next week’s CPI report puts the recovery to the test.

USD/JPY weekly outlook: US inflation threatens to break the stalemate
USD/JPY has barely budged in October, with the price trapped between key moving averages. Could US inflation finally deliver the catalyst needed to break the stalemate?

This report is intended for general circulation only. It should not be construed as a recommendation, or an offer (or solicitation of an offer) to buy or sell any financial products. The information provided does not take into account your specific investment objectives, financial situation or particular needs. Before you act on any recommendation that may be contained in this report, independent advice ought to be sought from a financial adviser regarding the suitability of the investment product, taking into account your specific investment objectives, financial situation or particular needs.
StoneX Financial Pte. Ltd., may distribute reports produced by its respective foreign entities or affiliates within the StoneX group of companies or third parties pursuant to an arrangement under Regulation 32C of the Financial Advisers Regulations. Where the report is distributed to a person in Singapore who is not an accredited investor, expert investor or an institutional investor (as defined in the Securities Futures Act), StoneX Financial Pte. Ltd. accepts legal responsibility to such persons for the contents of the report only to the extent required by law. Singapore recipients should contact StoneX Financial Pte. Ltd. at 6826 9988 for matters arising from, or in connection with the report.
In the case of all other recipients of this report, to the extent permitted by applicable laws and regulations neither StoneX Financial Pte. Ltd. nor its associated companies will be responsible or liable for any loss or damage incurred arising out of, or in connection with, any use of the information contained in this report and all such liability is hereby expressly disclaimed. No representation or warranty is made, express or implied, that the content of this report is complete or accurate.
StoneX Financial Pte. Ltd. is not under any obligation to update this report.
Trading CFDs carries a high level of risk that may not be suitable for some investors. Consider your investment objectives, level of experience, financial resources, risk appetite and other relevant circumstances carefully. The possibility exists that you could lose some or all of your investments, including your initial deposits. If in doubt, please seek independent expert advice. Visit www.forex.com/en-sg/terms-and-policies for the complete Risk Disclosure Statement.