



Gold Analysis: XAU/USD moves back toward the 5,200 zone following Trump’s speech
Although price movements in previous sessions have been more moderate compared to earlier weeks, over the last four trading sessions gold has posted gains of more than 4%, with price once again approaching the $5,200 per ounce area.
Share this:

Although price movements in previous sessions have been more moderate compared to earlier weeks, over the last four trading sessions gold has posted gains of more than 4%, with price once again approaching the $5,200 per ounce area.
For now, buying pressure has remained consistent, particularly after Trump’s State of the Union speech, where he once again emphasized the possibility of imposing global tariffs of around 15%. This scenario could limit a solid recovery in market confidence, which tends to favor gold as a safe-haven asset in the short term. If uncertainty surrounding trade tensions persists, it could become a relevant catalyst for stronger buying pressure in the coming sessions.


Is the tariff policy still in place?
During President Trump’s recent State of the Union address, he strongly defended the proposal of global tariffs near 15% on all imports entering the United States. He argued that the country has been treated unfairly in trade matters and that tariffs could help protect domestic jobs and industry. The president also stated that he would not easily back down in the face of pressure from the courts or from countries opposing his stance.
Reinforcing this message could increase structural trade risk at a global level and revive concerns about a prolonged trade conflict. This environment may heighten overall market risk perception, encouraging investors to seek more stable assets such as gold.
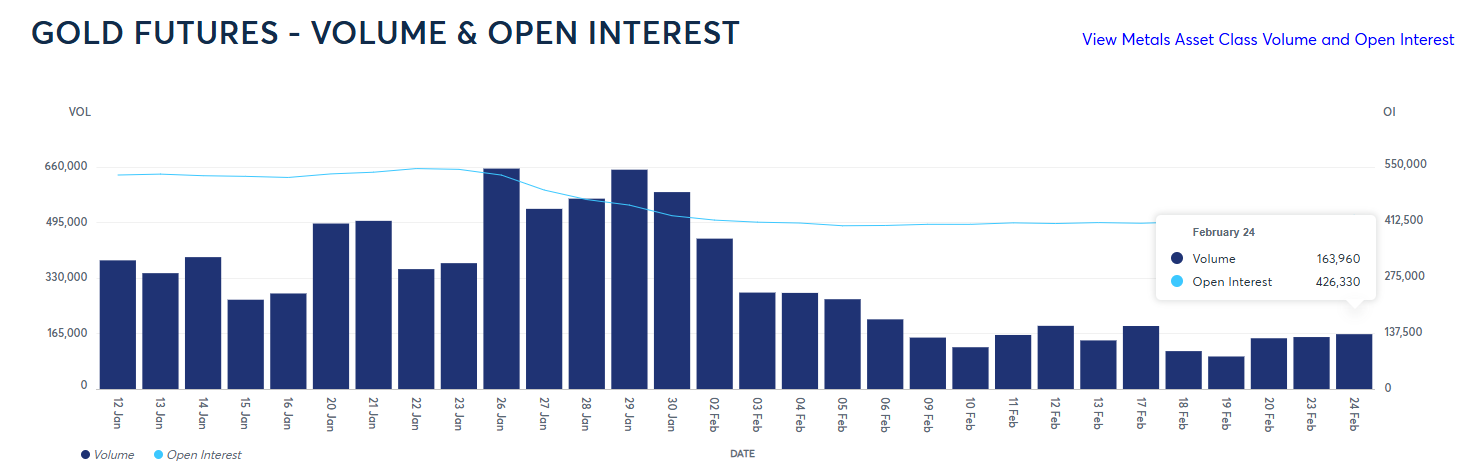
In fact, activity in the gold futures market has increased since the first tariff-related comments on February 20. Data comparing daily volume versus open interest show a rise in activity, with approximately 163,000 contracts traded on February 24, while open interest reached around 426,000 contracts, maintaining a positive slope. This behavior suggests that gold’s price increase has been accompanied by new long positions and stronger market participation, reinforcing the idea of stable safe-haven demand in the short term.
Source: CMEGROUP
Overall, tariff-related comments remain one of the key fundamental catalysts supporting interest in gold. As long as the tariff issue continues to generate uncertainty, it could keep adding appeal to the precious metal and support more consistent buying pressure in upcoming sessions.
Confidence attempts to recover but remains fragile
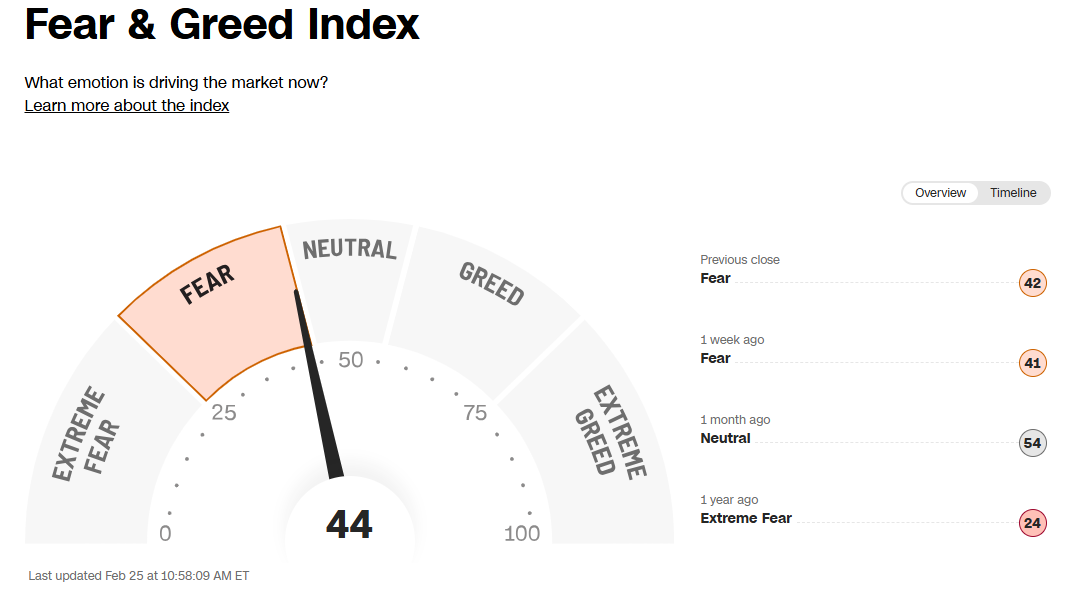
Gold typically benefits when market confidence indicators deteriorate significantly. Currently, the Fear and Greed Index stands around 44 points, remaining within “fear” territory. Although a slight recovery has been observed compared to previous sessions, the indicator still does not reflect solid stability in overall market sentiment.
Source: CNN
If the index fails to move back into at least neutral territory, it could signal that uncertainty remains present. In that context, gold may continue attracting demand as a safe haven, particularly if overall risk perception does not clearly improve in the short term.
Technical outlook for Gold
Source: StoneX, Tradingview
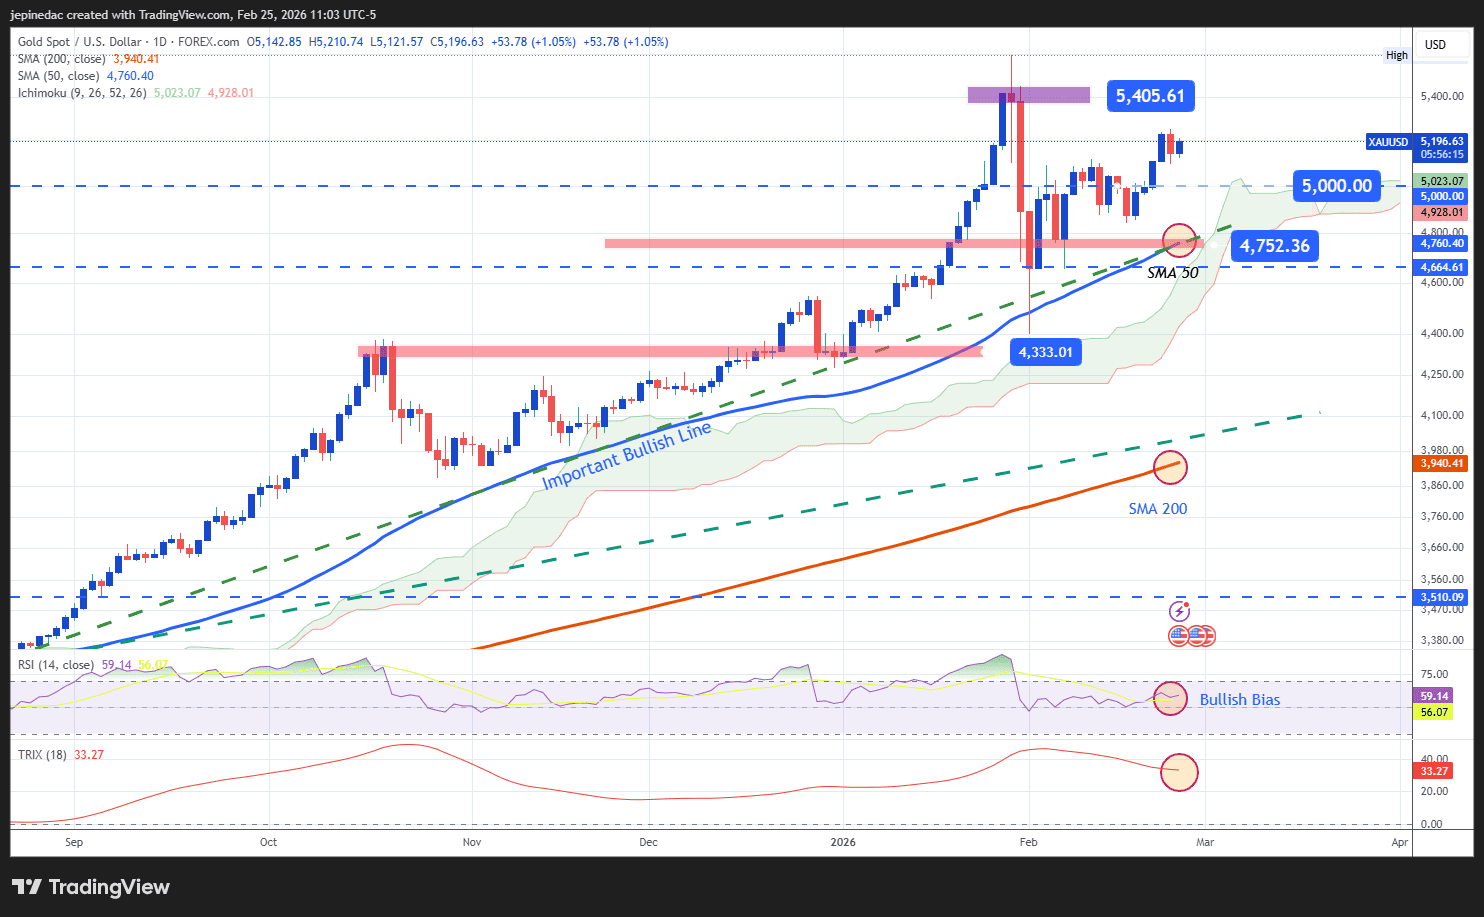
- Uptrend remains relevant: For several months, gold has maintained a strong upward trendline. The recent price recovery reinforces that this continues to be the dominant technical structure. Unless deeper corrections emerge that threaten this formation, the bullish bias may continue prevailing in the coming sessions.
- RSI: The RSI remains above the neutral 50 level, indicating that average bullish momentum over the last 14 sessions continues to dominate. If the indicator keeps advancing, it could reinforce stronger buying pressure in the short term.
- TRIX: The TRIX indicator also remains above the zero line, reflecting that the average strength of exponential moving averages is still in bullish territory. This supports the persistence of a dominant buying bias on the chart.
Key levels to monitor:
- $5,400 – Crucial resistance: Psychological level near historical highs. A sustained move toward this zone could consolidate dominant buying pressure and extend the bullish trend.
- $5,000 – Near-term barrier: Psychological level that has recently generated price neutrality. As long as gold fails to move decisively away from this area, a short-term sideways range and phase of indecision could develop in XAU/USD.
- $4,752 – Critical support: Zone aligned with recent lows, the main upward trendline, and the 50-period simple moving average. A sustained break below this level would put the current bullish structure at risk and could enable a more dominant selling bias in upcoming sessions.
Written by Julian Pineda, CFA, CMT – Market Analyst
Follow him on: @julianpineda25



Open an account in minutes
Experience award-winning platforms with fast and secure execution, and enjoy tight spreads from 0.5 pts on FX and 0.3 pts on indices.
Economic calendar
Web Trader platform
Our sophisticated web-based platform is packed with features.
Related articles

Gold Does Something it Hasn’t Done in a Year, is Larger Risk-Off Afoot?
With tech stocks getting hit harder last week there was collateral damage elsewhere, including gold as the metal closed below the $4k level for the week and that’s the first time that’s happened to spot gold in more than a year.


Silver forecast: metals liquidation drags XAG/USD into $50-55 support
Silver has broken its July low and slipped into a long-term support zone as the selling in precious metals deepens. The chart shows where the metal could bottom, and next week's Fed decision may decide whether it does.


Copper Tests 14-Month Support
Copper technical analysis shows prices pulling back from multi-year resistance alongside gold and silver, towards a 14-month uptrend support.

This report is intended for general circulation only. It should not be construed as a recommendation, or an offer (or solicitation of an offer) to buy or sell any financial products. The information provided does not take into account your specific investment objectives, financial situation or particular needs. Before you act on any recommendation that may be contained in this report, independent advice ought to be sought from a financial adviser regarding the suitability of the investment product, taking into account your specific investment objectives, financial situation or particular needs.
StoneX Financial Pte. Ltd., may distribute reports produced by its respective foreign entities or affiliates within the StoneX group of companies or third parties pursuant to an arrangement under Regulation 32C of the Financial Advisers Regulations. Where the report is distributed to a person in Singapore who is not an accredited investor, expert investor or an institutional investor (as defined in the Securities Futures Act), StoneX Financial Pte. Ltd. accepts legal responsibility to such persons for the contents of the report only to the extent required by law. Singapore recipients should contact StoneX Financial Pte. Ltd. at 6826 9988 for matters arising from, or in connection with the report.
In the case of all other recipients of this report, to the extent permitted by applicable laws and regulations neither StoneX Financial Pte. Ltd. nor its associated companies will be responsible or liable for any loss or damage incurred arising out of, or in connection with, any use of the information contained in this report and all such liability is hereby expressly disclaimed. No representation or warranty is made, express or implied, that the content of this report is complete or accurate.
StoneX Financial Pte. Ltd. is not under any obligation to update this report.
Trading CFDs carries a high level of risk that may not be suitable for some investors. Consider your investment objectives, level of experience, financial resources, risk appetite and other relevant circumstances carefully. The possibility exists that you could lose some or all of your investments, including your initial deposits. If in doubt, please seek independent expert advice. Visit www.forex.com/en-sg/terms-and-policies for the complete Risk Disclosure Statement.