



Gold, FTSE 100 Forecast: Two trades to watch
Gold falls as oil rises and the USD strengthens. FTSE falls as house prices slump.
Share this:

Gold falls as oil rises and the USD strengthens
Gold is edging lower on Monday, moving away from the two-week high around the 4,600 region reached on Friday and back towards the 4,500 psychological level. The move lower comes amid persistent geopolitical uncertainty and hawkish Fed expectations, which are lifting the USD.
US – Iran peace talks continue. However, the reopening of the Strait of Hormuz and Iran's nuclear programme remain key sticking points, preventing progress towards a final deal.
Meanwhile, Israeli Prime Minister Benjamin Netanyahu has ordered troops to move further into Lebanon despite a ceasefire announced more than six weeks ago. This adds to concerns of re-escalation of tensions in the Middle East.
The latest developments have lifted oil prices, which had fallen 10% last week, and are also underpinning the safe-haven dollar. A recovery in crude oil prices from one-month lows is reviving inflation concerns and boosting expectations that the Fed may need to keep policy restrictive for longer, capping gains in non-yielding gold.
Gold has struggled to attract sustained safe-haven demand throughout the Middle East conflict. This suggests that rising Treasury yields and a stronger dollar remain the dominant drivers, with investors prioritising the outlook for interest rates over geopolitical risks.
This week, attention will be on U.S. economic data and Fed speakers for further clues over the Federal Reserve's policy outlook.
Federal Reserve Vice Chair Michelle Bowman said on Friday that the Middle East's impact on the economy was still being assessed and could lead to a persistent rise in inflation, potentially requiring tighter monetary policy.
Today, U.S. ISM manufacturing PMI data is due. However, the main focus will be Friday's non-farm payroll report, which could influence the Fed's policy path in the near term. Strong jobs data alongside elevated inflation could support the view that the Fed will keep rates higher for longer, undermining demand for Gold.
Gold forecast – technical analysis
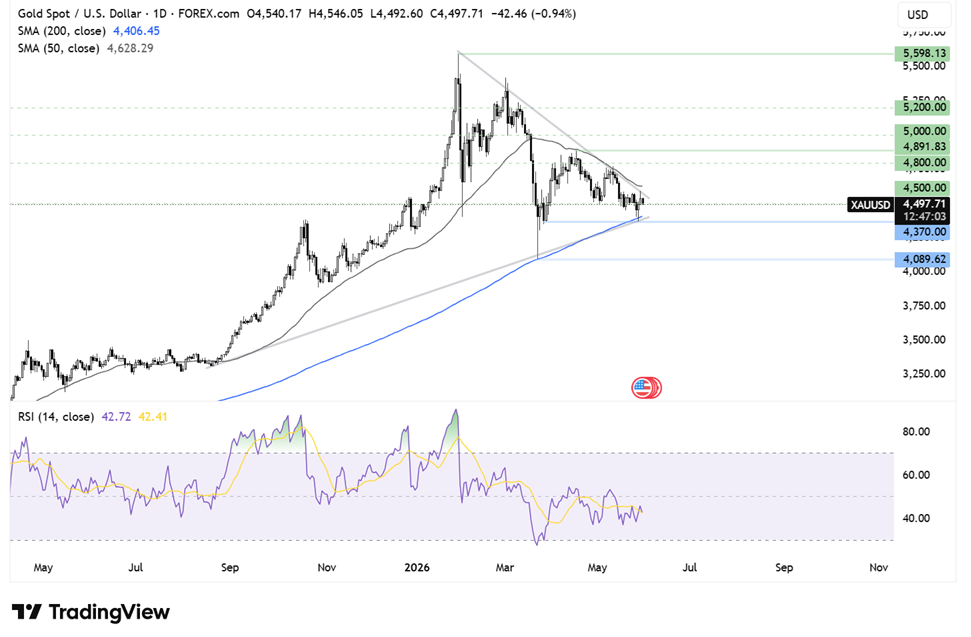
Gold trades within a symmetrical triangle pattern. The price recently recovered from the 4,360 May low, which also coincides with the 200 SMA and rising trendline support. The recovery stalled at the falling trendline resistance and remains below the 50 SMA. The RSI remains below 50, indicating momentum is still favouring sellers.
Sellers will look for a break below the 200 SMA at 4,400 and the 4,360 May low to create a lower low and extend losses towards 4,100, the 2026 low.
Buyers will need to rise above the 4,600 resistance zone — last week's high, falling trendline resistance and the 50 SMA at 4,630 — to signal a bullish breakout and bring 4,800 into focus ahead of 5,000.
FTSE falls as house prices slump
The FTSE is trading under pressure, underperforming its European peers amid a lack of technology exposure and as rising oil prices fuel inflation concerns and push bond yields higher.
The increase in borrowing costs triggered by the Iran conflict and domestic political uncertainty is now starting to weigh on the UK housing market.
UK house prices fell 0.6%, marking the fastest monthly decline in almost a year and taking the average house price to £278,024. The drop was significantly larger than the 0.2% decline economists had expected and suggests higher borrowing costs are finally starting to weigh on demand after the housing market proved surprisingly resilient through the early stages of the Middle East conflict.
While house prices have held up reasonably well so far, momentum is beginning to fade. Wage growth is struggling to keep pace with inflation, while higher mortgage rates are reducing affordability and limiting how much buyers can borrow.
Other surveys, including one from the Royal Institution of Chartered Surveyors, have also pointed to further weakness in the months ahead. Given rising energy costs, ongoing geopolitical uncertainty and expectations that the Bank of England may need to tighten policy further, the housing market appears increasingly vulnerable to a slowdown.
Before the start of the Middle East conflict, markets were pricing in one or possibly two Bank of England rate cuts this year. Now, expectations have shifted dramatically, with markets increasingly pricing in the possibility of higher rates into 2026.
Housebuilders such as Taylor Wimpey and Persimmon are down around 1% as investors assess the implications of weaker housing demand.
Industrial metal miners are among the top performers after China's NBS Composite PMI rose to 50.5 in May from 50.1 previously, marking a third consecutive month of expansion. The data suggest activity in the world's second-largest economy remains resilient despite geopolitical uncertainty, supporting expectations for industrial commodity demand.
China's RatingDog manufacturing PMI eased to 51.8 in May but still beat expectations of 51.4. While activity slowed from April's 52.2 reading, the figures continue to point to a manufacturing sector that is holding up relatively well despite rising energy costs and a more challenging global backdrop.
Precious metal miners such as Fresnillo and Endeavour Mining are among the biggest fallers, down almost 3% as lower gold prices weigh on sentiment.
Meanwhile, oil majors such as Shell and BP are rising around 1% as crude prices recover.
easyJet has jumped more than 10% after responding to reports of takeover interest from Castlelake Private Equity, stating that it had not received any proposal.
FTSE forecast – technical analysis
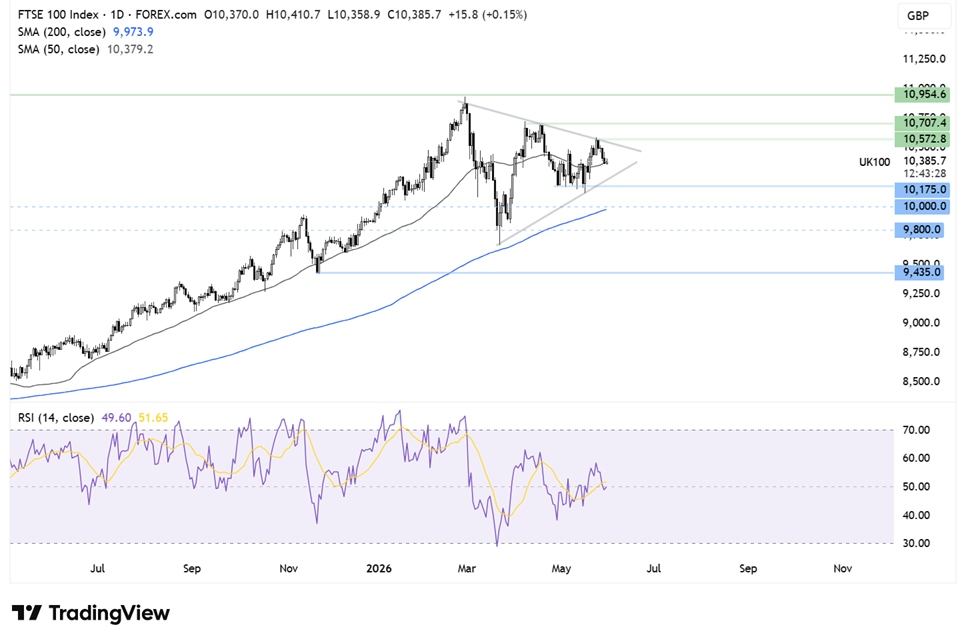
The FTSE 100 is also trading within a symmetrical triangle pattern. The index recently recovered from rising trendline support at 10,110 before running into resistance at 10,600, the May high and the falling trendline resistance.
From there, the price has pulled back and is currently testing the 50 SMA at 10,375, which also marks the midpoint of the symmetrical triangle. This area has acted as an important pivot point in recent weeks and could determine whether the FTSE breaks higher towards fresh highs or remains trapped within its consolidation range. The RSI remains neutral, reflecting the market's wait-and-see approach.
Should the 50 SMA support hold, buyers will look to break above the falling trendline resistance at 10,540 and the May high at 10,600 to create a higher high and bring 10,700, the April high, into focus before targeting 10,950 and fresh record highs.
A failure of the 50 SMA to hold could see the price test rising trendline support at 10,250. It would take a break below support around 10,180 to create a lower low, exposing 10,000 and the 200 SMA.
Related tags:



Open an account in minutes
Experience award-winning platforms with fast and secure execution, and enjoy tight spreads from 0.5 pts on FX and 0.3 pts on indices.
Economic calendar
Web Trader platform
Our sophisticated web-based platform is packed with features.
Related articles

Gold Price Outlook: XAU/USD Resistance at $4200 Sets Up for NFP
It was a strong sell-off to start the week in gold and despite a Tuesday bounce, sellers are continuing to push following a resistance hit at the $4200 level.


GBP/USD, Oil Forecast: Two trades to watch 300926
GBP/USD: Can Stronger UK Growth Offset the Dollar’s Advantage? Oil: Supply Recovery Challenges the Geopolitical Premium.

Gold Forecast: Are Bears Regaining Control of XAU/USD?
The start of the trading week has not been particularly favorable for gold. This can be seen in recent XAU/USD price action, with the metal falling nearly 4.00% over the last two trading sessions and bringing renewed attention to a bearish bias within the market.

This report is intended for general circulation only. It should not be construed as a recommendation, or an offer (or solicitation of an offer) to buy or sell any financial products. The information provided does not take into account your specific investment objectives, financial situation or particular needs. Before you act on any recommendation that may be contained in this report, independent advice ought to be sought from a financial adviser regarding the suitability of the investment product, taking into account your specific investment objectives, financial situation or particular needs.
StoneX Financial Pte. Ltd., may distribute reports produced by its respective foreign entities or affiliates within the StoneX group of companies or third parties pursuant to an arrangement under Regulation 32C of the Financial Advisers Regulations. Where the report is distributed to a person in Singapore who is not an accredited investor, expert investor or an institutional investor (as defined in the Securities Futures Act), StoneX Financial Pte. Ltd. accepts legal responsibility to such persons for the contents of the report only to the extent required by law. Singapore recipients should contact StoneX Financial Pte. Ltd. at 6826 9988 for matters arising from, or in connection with the report.
In the case of all other recipients of this report, to the extent permitted by applicable laws and regulations neither StoneX Financial Pte. Ltd. nor its associated companies will be responsible or liable for any loss or damage incurred arising out of, or in connection with, any use of the information contained in this report and all such liability is hereby expressly disclaimed. No representation or warranty is made, express or implied, that the content of this report is complete or accurate.
StoneX Financial Pte. Ltd. is not under any obligation to update this report.
Trading CFDs carries a high level of risk that may not be suitable for some investors. Consider your investment objectives, level of experience, financial resources, risk appetite and other relevant circumstances carefully. The possibility exists that you could lose some or all of your investments, including your initial deposits. If in doubt, please seek independent expert advice. Visit www.forex.com/en-sg/terms-and-policies for the complete Risk Disclosure Statement.