



Gold Holds 200-Day EMA, Futures and Options Hint at ‘Dip-Buying Mentality’
Gold holds support at its 200-day EMA as futures positioning and options sentiment point to persistent dip-buying interest ahead of NFP.
Share this:

Gold has found support around its 200-day EMA as futures positioning strengthens and options traders retain a relatively bullish skew. With NFP approaching, the setup keeps the prospect of another push towards 5,000 alive.
View related analysis:
View related analysis:
Gold Support Holds as Positioning Backs the Dip-Buying Case
Gold Price Analysis: Futures (GC)
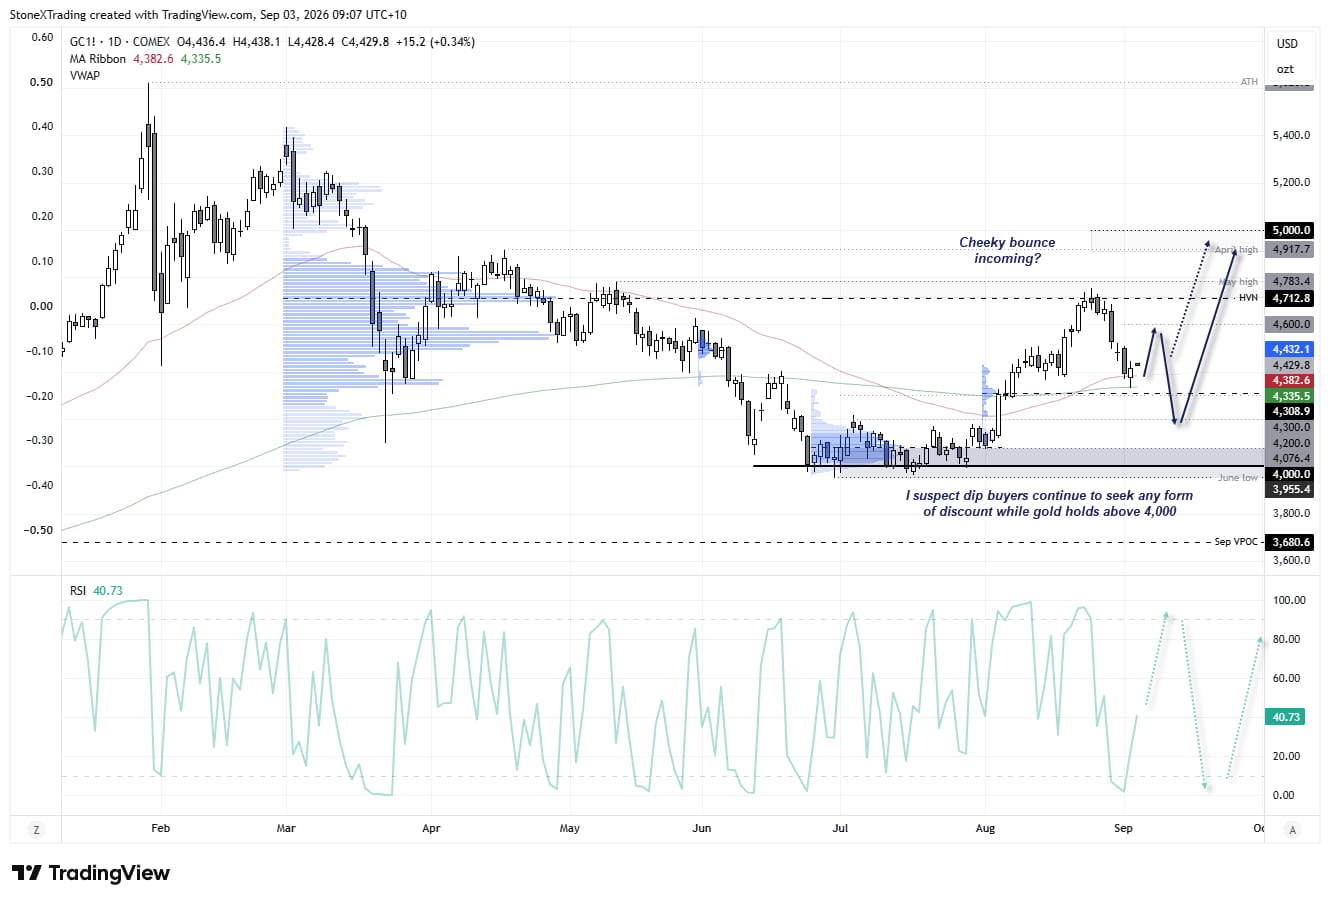
We saw the pullback on gold in line with my bias last week. It seemed like a reasonable assumption, given we’d already seen a decent move into resistance and were heading into inflation data and a likely hawkish Jackson Hole speech. Yet support has since been found around its 200-day EMA and historical weekly VPOC (volume point of control).
A small bullish candle shows that bears lost steam around that support level, while the above-average volume relative to the small-range day suggests a ‘change of hands’ from bears to bulls. Given the US dollar rally has also formed a doji around its 50-day EMA to hint at resistance holding over the near term, I am on guard for at least a cheeky bounce towards 4600, near its weekly pivot point.
Gold Bulls Eye 5,000 While 4,300 Support Holds
Whether gold can simply rally from here and break above 4800 sits in the hands of US economic data, Fed expectations and the US dollar. But the higher timeframes continue to suggest gold could eventually break above 5,000.
If momentum peters out and turns south, a break below 4300 brings the 4076 VPOC into focus. For now, this seems like an outside chance, and I continue to suspect dip buyers are keen to snap up gold bars at a discount with another crack at 5,000 in mind.
Source: ICE, TradingView
Gold Futures Positioning Supports the 5,000 Case
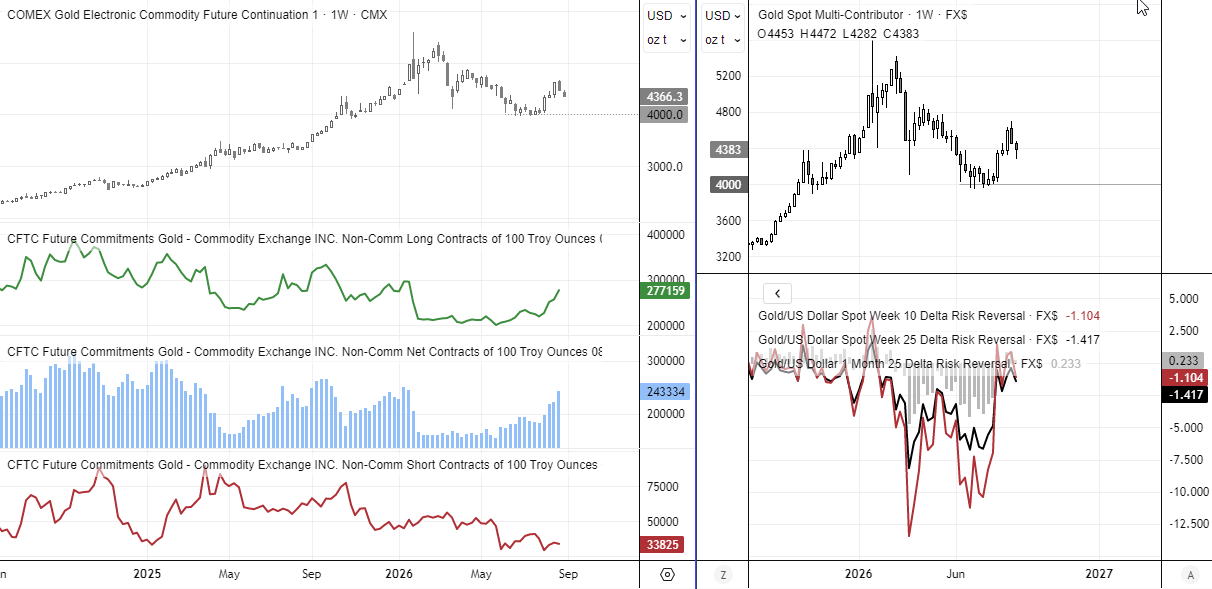
A quick reminder as to why I still think a rally to 5,000 is on the cards. Net-long exposure to gold futures has continued to trend higher, with rising longs and diminishing shorts. A similar pattern can be seen among asset managers, though this is not visible on the left chart for the sake of simplicity.
Note the two-bar bearish reversal on the gold futures chart – a dark cloud cover. Yet already the gold pullback is losing steam. My bias has been to seek dips within the three-week rally, which showed strong bullish range expansion following compression around 4,000 support.
Options Traders Keep the Dip-Buying Bias Alive
Moreover, options traders have significantly reduced their bias towards puts (downside protection), with risk reversals temporarily flipping back in favour of calls. While they have dipped back below zero to show a bias towards puts in aggregate, risk reversals remain elevated despite the pullback in gold prices.
Therefore, I continue to favour the ‘dip-buying mentality’ of gold traders over the coming weeks or months unless the US dollar can truly rally. But even then, my bias for now is that the US dollar has topped for the year.
Source: COMEX, CME, CFTC (COT), LSEG
Gold Volatility Peaks Ahead of NFP, Then Fades
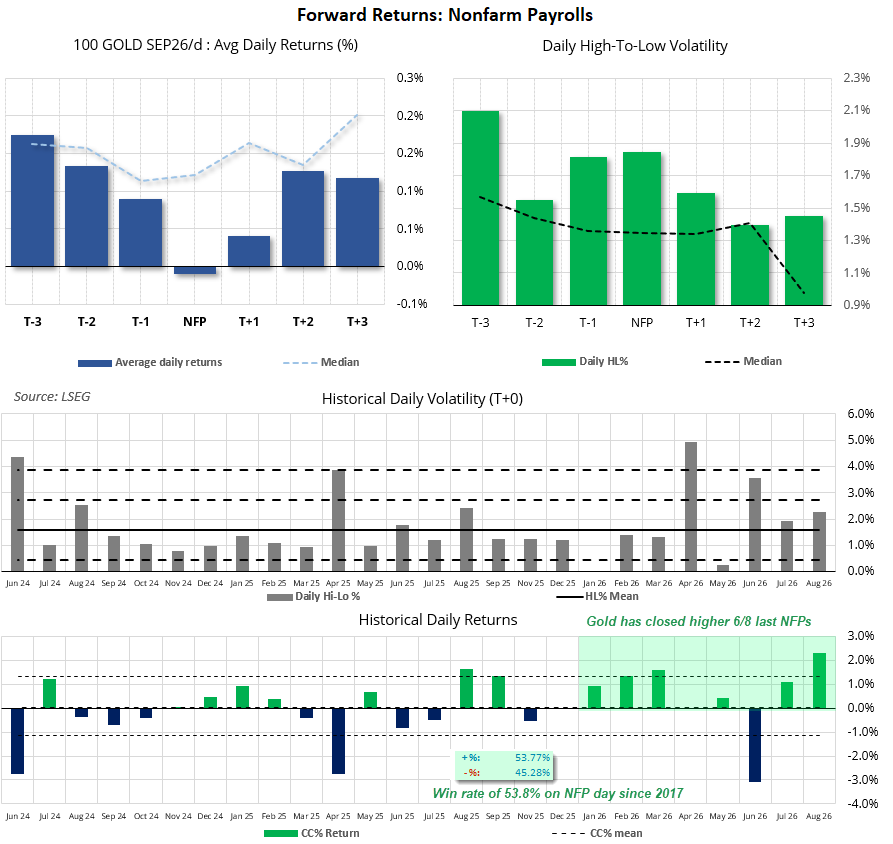
I have been releasing forward returns charts this week to show how some markets have historically performed over the three days either side of NFP. The general pattern has been that volatility peaks notably on NFP day, yet average and median returns have been too close to +/- 0.1% to assume any directional bias beyond the probability of a coin flip.
Gold shows a similar pattern, with minimal returns around zero, yet its daily high-to-low volatility actually declines throughout the forward return window. Specifically, the average daily range peaks at 2.1% on the Tuesday prior to NFP (T-3), halves on T-2 before another peak of 1.85% on NFP day, then continues to trend lower into the following week.
Median ranges – which provide a better representation of a typical NFP period – also peak at T-3, but at the lower level of 1.6%, before reaching 1.3% on both NFP day and T+1.
That said, the directional bias on NFP day for gold is slightly bullish, with a win rate of 53.8%. Also note that gold has closed higher on six of the past eight NFP days. For us to expect gold to trade higher on Friday likely requires a softer NFP print, and recent US data suggests that remains plausible.
Source: COMEX, LSEG
Gold vs NFP: Trader Takeaways
- Gold volatility has historically peaked before NFP, with average ranges reaching 2.1% at T-3.
- NFP-day volatility remains elevated, but average returns show little reliable directional bias.
- Gold has a slight historical bullish skew on NFP day, with a 53.8% win rate.
- Gold has closed higher on six of the past eight NFP days, although Friday's direction will likely hinge on the payrolls surprise.
Related tags:


Open an account in minutes
Experience award-winning platforms with fast and secure execution, and enjoy tight spreads from 0.5 pts on FX and 0.3 pts on indices.
Economic calendar
Web Trader platform
Our sophisticated web-based platform is packed with features.
Related articles

Japanese Yen Outlook: USD/JPY, GBP/JPY, AUD/JPY Setups
USD/JPY and GBP/JPY show signs of stabilising, while AUD/JPY remains vulnerable as yen crosses deliver mixed technical signals.

Gold Price Outlook: XAU/USD Resistance at $4200 Sets Up for NFP
It was a strong sell-off to start the week in gold and despite a Tuesday bounce, sellers are continuing to push following a resistance hit at the $4200 level.


The RBA Hiked Rates and the Australian Dollar Still Fell
AUD/USD fell after the RBA rate hike because the central bank's hawkish stance was already priced in while the U.S. dollar stayed firm.

This report is intended for general circulation only. It should not be construed as a recommendation, or an offer (or solicitation of an offer) to buy or sell any financial products. The information provided does not take into account your specific investment objectives, financial situation or particular needs. Before you act on any recommendation that may be contained in this report, independent advice ought to be sought from a financial adviser regarding the suitability of the investment product, taking into account your specific investment objectives, financial situation or particular needs.
StoneX Financial Pte. Ltd., may distribute reports produced by its respective foreign entities or affiliates within the StoneX group of companies or third parties pursuant to an arrangement under Regulation 32C of the Financial Advisers Regulations. Where the report is distributed to a person in Singapore who is not an accredited investor, expert investor or an institutional investor (as defined in the Securities Futures Act), StoneX Financial Pte. Ltd. accepts legal responsibility to such persons for the contents of the report only to the extent required by law. Singapore recipients should contact StoneX Financial Pte. Ltd. at 6826 9988 for matters arising from, or in connection with the report.
In the case of all other recipients of this report, to the extent permitted by applicable laws and regulations neither StoneX Financial Pte. Ltd. nor its associated companies will be responsible or liable for any loss or damage incurred arising out of, or in connection with, any use of the information contained in this report and all such liability is hereby expressly disclaimed. No representation or warranty is made, express or implied, that the content of this report is complete or accurate.
StoneX Financial Pte. Ltd. is not under any obligation to update this report.
Trading CFDs carries a high level of risk that may not be suitable for some investors. Consider your investment objectives, level of experience, financial resources, risk appetite and other relevant circumstances carefully. The possibility exists that you could lose some or all of your investments, including your initial deposits. If in doubt, please seek independent expert advice. Visit www.forex.com/en-sg/terms-and-policies for the complete Risk Disclosure Statement.