







Gold Price Forecast: Reversal or Pullback?
Gold prices were smashed on the night of the election, similar to what showed in 2016 when the US Dollar posed a stark turn-around on news that Donald Trump would prevail.
Share this:

Gold Talking Points:
- It’s been a banner year for gold with the metal rising as much as 40.61% from its 2024 lows, but that trend has been overbought on the monthly chart since April, and on the weekly chart since early-September.
- The election night brought a strong sell-off in gold and at this point the question remains as to whether that’s the start of a reversal or whether it was a simple pullback in a broader bullish trend. So far, there’s been a strong reaction to 2650 support but it’s how the metal performs at tests of possible resistance that can provide early clues to bigger-picture direction.
- I look at gold in-depth from a number of time frames each week in the webinar, and it’s free to attend. Click here for registration information.
Gold prices staged a massive sell-off on the night of the election, even as many other markets showed strength. The run in the US Dollar was notable and we’ve already seen that move soften a bit. As I highlighted in the video and article yesterday, with all of US rates, US equities and the US Dollar moving higher in tandem it really felt as though it was more a show of volatility than a sign of what’s to come. It remains unlikely that all three markets continue to go up for an extended period of time, and in my estimation, it’s the US Dollar that’s probably the most vulnerable to reversion. Since then, the USD has pulled back more and this has helped USD-denominated assets, such as EUR/USD and Gold, bounce a bit. But there may be more going on here and I wanted to focus-in on gold in this article.
In the pre-Election webinar I looked at a couple of waypoints in prediction markets to deduce relevant relationships in markets. And it was around October 9th and 10th when Trump’s odds started to pull away from Harris. Those odds had peaked before the election on the 29th of the month at 65% and then they narrowed for the next week.
As I showed in both the US Dollar and Bitcoin, it seemed a clear relationship existed, where Trump’s rising odds of victory came along with a stronger Dollar and higher prices in Bitcoin. But – a similar relationship held in gold, as gold prices bottomed on the morning of October 10th right around the release of CPI last month, and the current high formed on the 30th, just after Trump’s odds had peaked before the election.
Gold Daily Price Chart
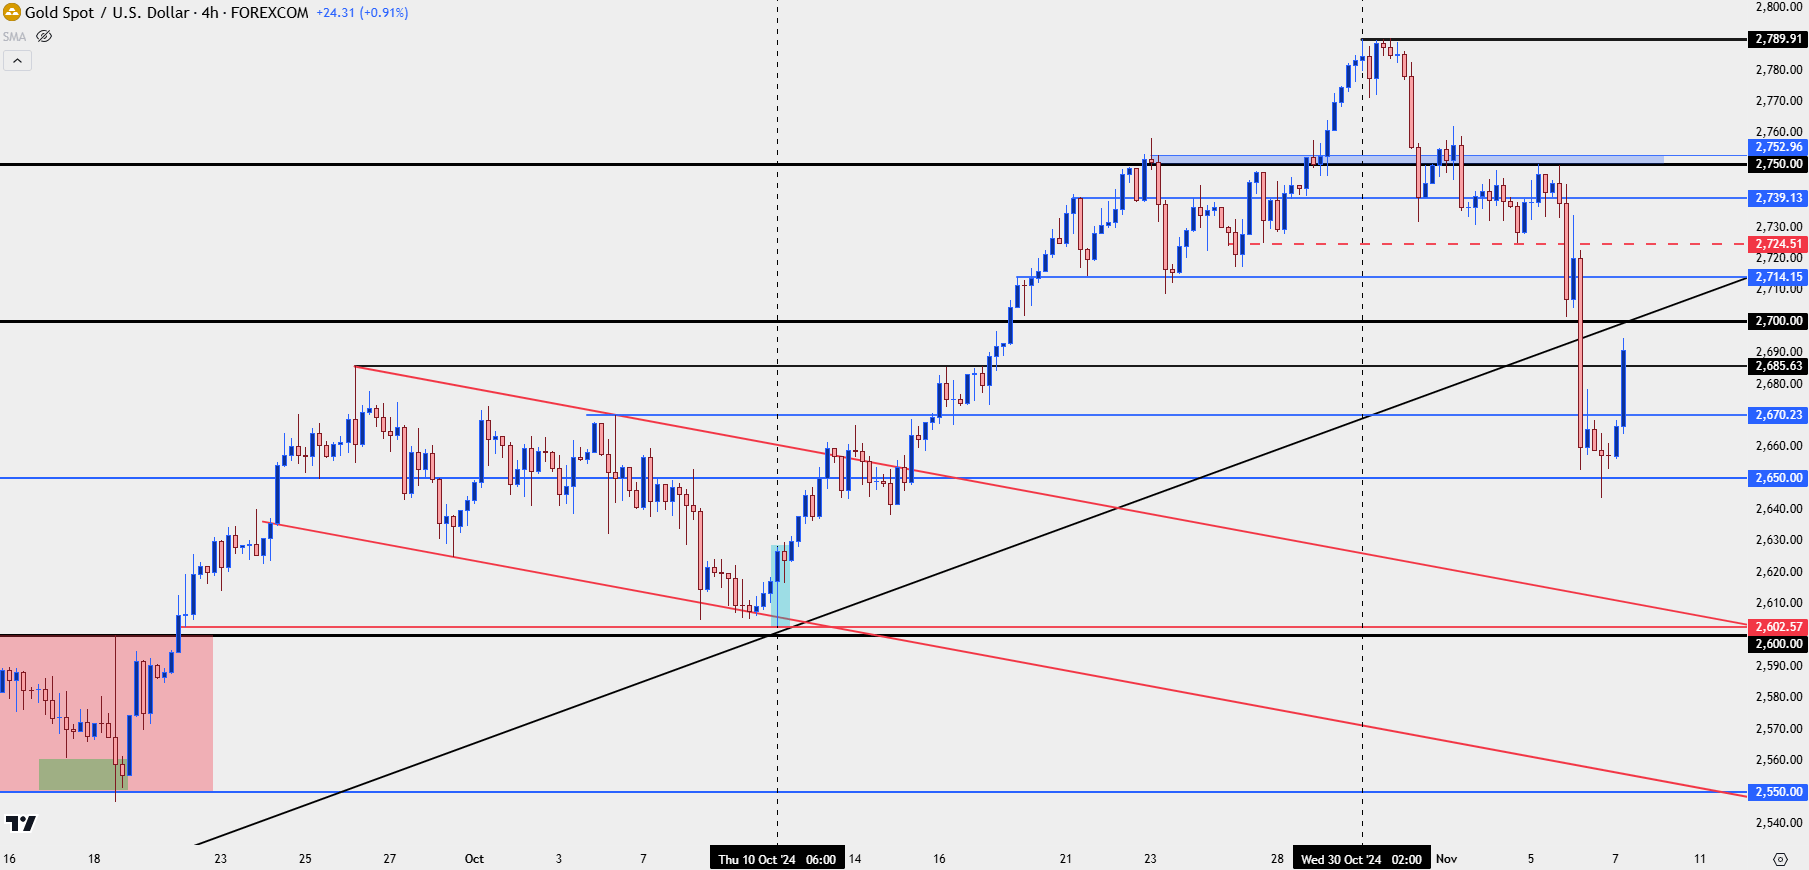 Chart prepared by James Stanley; data derived from Tradingview
Gold: The Fundamental Case
On its face it doesn’t seem as though there’s enough difference between expectations around Trump and Harris to completely change the outlook on gold. Both sides are likely to push growth-centered policies and neither side seems interested in reducing US debt and balancing the budget. As noted in the video yesterday, there could be a difference in Fed policy especially considering that Republicans have gained a likely supermajority. But, that’s unlikely to bring on a prioritization of limiting US debt as the behest of growth.
What could be of more interest, however, is competition as an anti-fiat vehicle from Bitcoin, and that’s something worth watching as the cryptocurrency has continued to push to fresh all-time-highs in the aftermath of the election.
But I think what we saw on election night and something that’s worth watching for the next few weeks and into the end of the year was the rally in the US Dollar, which resembles something similar from Trump’s first victory in 2016.
In that episode, the USD staged a stark turn-around as election results came in and this led to a massive move of USD-strength that ran for the next month. But this was accompanied by an increasingly-hawkish FOMC, as Janet Yellen had said that an incoming Republican supermajority at the time was likely to lean on fiscal stimulus, and monetary policy would need to buffer that. Lo and behold, the Fed hiked for only the second time since the Financial Collapse at their rate decision in December and they went on to hike three more times in 2017 and four more times in 2018. So, that attempt to buffer seemed to be on full display.
More interesting, however, is the US Dollar. While it initially gained on the back of Trump’s win in 2016, hitting a fresh high in December, it then went into a sell-off for the next year-and-change, even as the Fed was hiking rates. This similarly had impact on gold.
On the night of the election, as the US Dollar posed a brisk bullish reversal, the mirror image showed in gold. And then as the Dollar gained into December, eventually topping in the middle of the month, gold sold off until bottoming around the same time that the Dollar topped.
And then in 2017 as the USD tanked, gold prices rose briskly.
Gold Weekly Price Chart
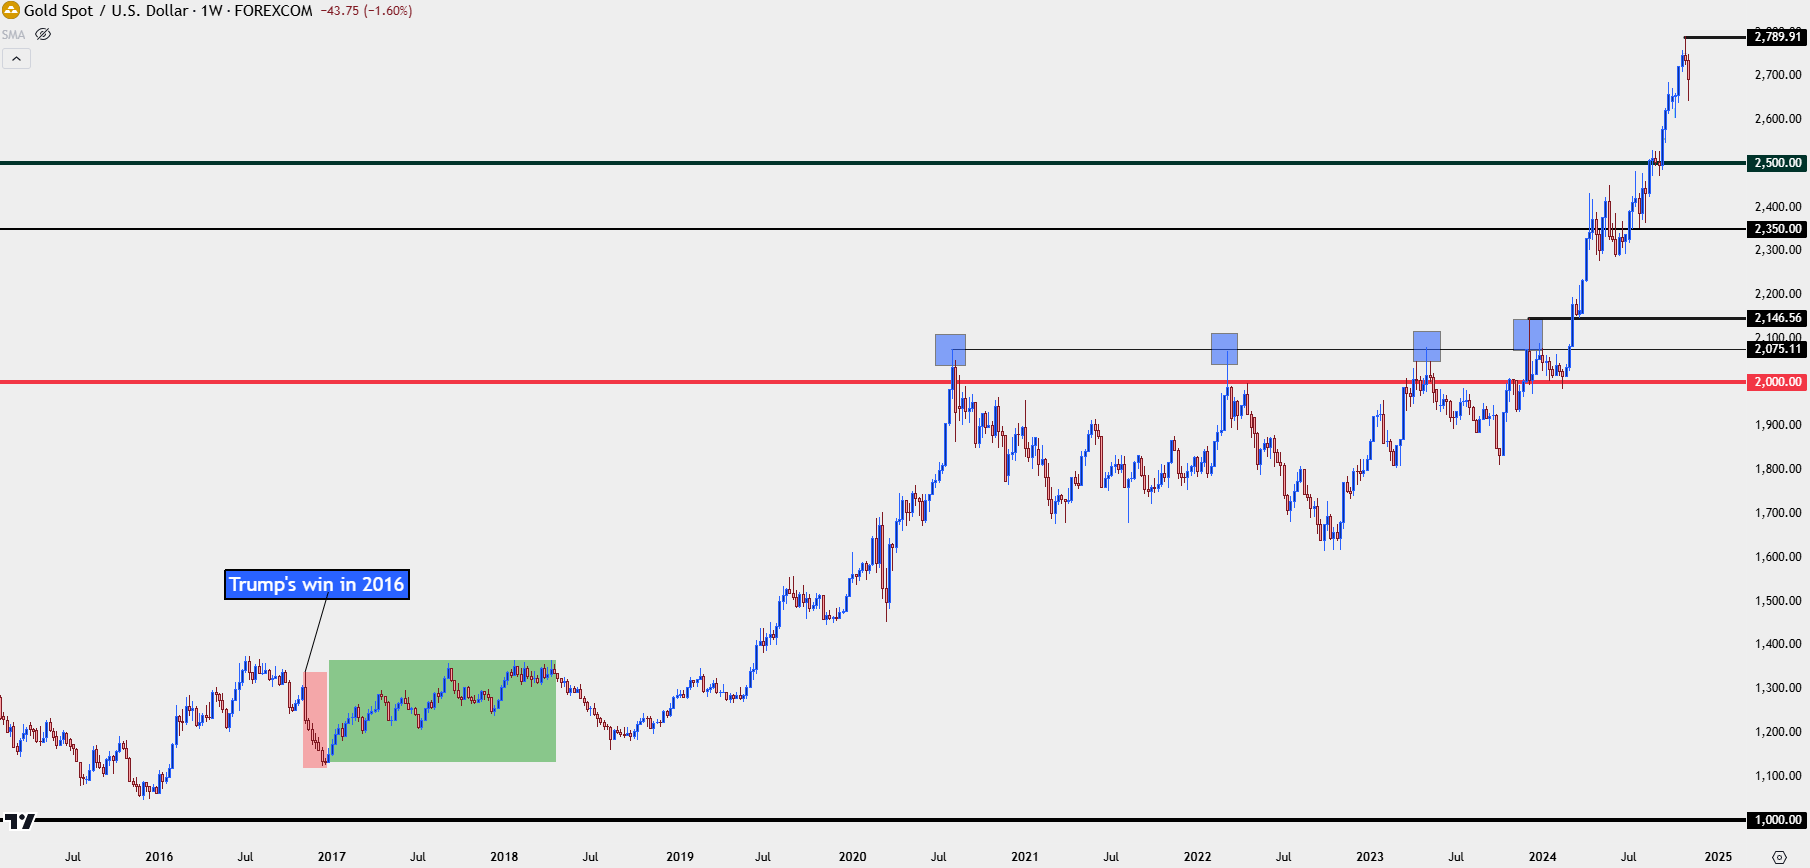 Chart prepared by James Stanley; data derived from Tradingview
Gold and USD
Spot gold is priced in US Dollars as can be seen in the quote of XAU/USD. So logically an inverse relationship can exist simply due to the mathematics of the situation. But – that’s not the only factor at-play in gold which is why a perfectly inverse correlation does not exist. Sometimes that will show, such as what we saw back in Q4 of 2016. But, others, such as we’ve seen this year, that relationship can wax and wane.
On the part of the US Dollar, I expect the two-year range to continue and the response we’ve seen over the past 24 hours to resistance speaks to that. Accordingly, that’s helped gold to bounce. But the bigger question, in my opinion, is whether we see some element of prudence from the FOMC regarding rate policy.
As the Fed continued to push more and more dovish through 2024, even as US economic data remained strong, gold prices continued to trend higher with bulls defending and protecting support with a degree of aggression. A great example is that swing-low last month on the morning of US CPI, when the data came out above expectation which would normally be construed as a negative factor for gold prices. But price action was anything but negative and from that deduction we can glean the fact that markets aren’t expecting the Fed to walk away from their desire and pledge to cut rates this year.
Later today another rate cut is expected from the FOMC. This is not a quarterly meeting, so there’s no updated projections or guidance to work from. It’s Powell’s hints at the presser that will likely be the driver.
But I think the real message will be in price action: Whether we see longs that have been building positions this year paring exposure on tests of resistance at prior support. So far, at this early stage we’ve seen an aggressive bounce from 2650 and buyers have shredded through 2685. The next big level on the horizon is 2700 and if this is a stumbling block for buyers it can start to build an argument for lower-highs. Above that, 2714 remains key as this was a support level that was tested a couple of different times. Above that, 2724.51 which held a bounce into a lower-high earlier in the week, with sellers aggressive defending 2750.
To work with shorter-term bullish biases, traders can essentially look to those resistance points as higher-low supports following bullish confirmation from breakouts. So if 2700 trades, 2685 becomes a possible point of higher-low support. If 2714 trades, both 2700 and 2685 are in the equation.
For me to consider this a resumption of the bullish trend on a big picture basis, I want to see buyers drive trends above the 2750 level that held lower-highs on Tuesday as election results had started to flow in.
Gold Four-Hour Price Chart
 Chart prepared by James Stanley; data derived from Tradingview
--- written by James Stanley, Senior Strategist
Gold Talking Points:
- It’s been a banner year for gold with the metal rising as much as 40.61% from its 2024 lows, but that trend has been overbought on the monthly chart since April, and on the weekly chart since early-September.
- The election night brought a strong sell-off in gold and at this point the question remains as to whether that’s the start of a reversal or whether it was a simple pullback in a broader bullish trend. So far, there’s been a strong reaction to 2650 support but it’s how the metal performs at tests of possible resistance that can provide early clues to bigger-picture direction.
Gold prices staged a massive sell-off on the night of the election, even as many other markets showed strength. The run in the US Dollar was notable and we’ve already seen that move soften a bit. As I highlighted in the video and article yesterday, with all of US rates, US equities and the US Dollar moving higher in tandem it really felt as though it was more a show of volatility than a sign of what’s to come. It remains unlikely that all three markets continue to go up for an extended period of time, and in my estimation, it’s the US Dollar that’s probably the most vulnerable to reversion. Since then, the USD has pulled back more and this has helped USD-denominated assets, such as EUR/USD and Gold, bounce a bit. But there may be more going on here and I wanted to focus-in on gold in this article.
In the pre-Election webinar I looked at a couple of waypoints in prediction markets to deduce relevant relationships in markets. And it was around October 9th and 10th when Trump’s odds started to pull away from Harris. Those odds had peaked before the election on the 29th of the month at 65% and then they narrowed for the next week.
As I showed in both the US Dollar and Bitcoin, it seemed a clear relationship existed, where Trump’s rising odds of victory came along with a stronger Dollar and higher prices in Bitcoin. But – a similar relationship held in gold, as gold prices bottomed on the morning of October 10th right around the release of CPI last month, and the current high formed on the 30th, just after Trump’s odds had peaked before the election.
Gold Daily Price Chart
Chart prepared by James Stanley; data derived from Tradingview
Gold: The Fundamental Case
On its face it doesn’t seem as though there’s enough difference between expectations around Trump and Harris to completely change the outlook on gold. Both sides are likely to push growth-centered policies and neither side seems interested in reducing US debt and balancing the budget. As noted in the video yesterday, there could be a difference in Fed policy especially considering that Republicans have gained a likely supermajority. But, that’s unlikely to bring on a prioritization of limiting US debt as the behest of growth.
What could be of more interest, however, is competition as an anti-fiat vehicle from Bitcoin, and that’s something worth watching as the cryptocurrency has continued to push to fresh all-time-highs in the aftermath of the election.
But I think what we saw on election night and something that’s worth watching for the next few weeks and into the end of the year was the rally in the US Dollar, which resembles something similar from Trump’s first victory in 2016.
In that episode, the USD staged a stark turn-around as election results came in and this led to a massive move of USD-strength that ran for the next month. But this was accompanied by an increasingly-hawkish FOMC, as Janet Yellen had said that an incoming Republican supermajority at the time was likely to lean on fiscal stimulus, and monetary policy would need to buffer that. Lo and behold, the Fed hiked for only the second time since the Financial Collapse at their rate decision in December and they went on to hike three more times in 2017 and four more times in 2018. So, that attempt to buffer seemed to be on full display.
More interesting, however, is the US Dollar. While it initially gained on the back of Trump’s win in 2016, hitting a fresh high in December, it then went into a sell-off for the next year-and-change, even as the Fed was hiking rates. This similarly had impact on gold.
On the night of the election, as the US Dollar posed a brisk bullish reversal, the mirror image showed in gold. And then as the Dollar gained into December, eventually topping in the middle of the month, gold sold off until bottoming around the same time that the Dollar topped.
And then in 2017 as the USD tanked, gold prices rose briskly.
Gold Weekly Price Chart
Chart prepared by James Stanley; data derived from Tradingview
Gold and USD
Spot gold is priced in US Dollars as can be seen in the quote of XAU/USD. So logically an inverse relationship can exist simply due to the mathematics of the situation. But – that’s not the only factor at-play in gold which is why a perfectly inverse correlation does not exist. Sometimes that will show, such as what we saw back in Q4 of 2016. But, others, such as we’ve seen this year, that relationship can wax and wane.
On the part of the US Dollar, I expect the two-year range to continue and the response we’ve seen over the past 24 hours to resistance speaks to that. Accordingly, that’s helped gold to bounce. But the bigger question, in my opinion, is whether we see some element of prudence from the FOMC regarding rate policy.
As the Fed continued to push more and more dovish through 2024, even as US economic data remained strong, gold prices continued to trend higher with bulls defending and protecting support with a degree of aggression. A great example is that swing-low last month on the morning of US CPI, when the data came out above expectation which would normally be construed as a negative factor for gold prices. But price action was anything but negative and from that deduction we can glean the fact that markets aren’t expecting the Fed to walk away from their desire and pledge to cut rates this year.
Later today another rate cut is expected from the FOMC. This is not a quarterly meeting, so there’s no updated projections or guidance to work from. It’s Powell’s hints at the presser that will likely be the driver.
But I think the real message will be in price action: Whether we see longs that have been building positions this year paring exposure on tests of resistance at prior support. So far, at this early stage we’ve seen an aggressive bounce from 2650 and buyers have shredded through 2685. The next big level on the horizon is 2700 and if this is a stumbling block for buyers it can start to build an argument for lower-highs. Above that, 2714 remains key as this was a support level that was tested a couple of different times. Above that, 2724.51 which held a bounce into a lower-high earlier in the week, with sellers aggressive defending 2750.
To work with shorter-term bullish biases, traders can essentially look to those resistance points as higher-low supports following bullish confirmation from breakouts. So if 2700 trades, 2685 becomes a possible point of higher-low support. If 2714 trades, both 2700 and 2685 are in the equation.
For me to consider this a resumption of the bullish trend on a big picture basis, I want to see buyers drive trends above the 2750 level that held lower-highs on Tuesday as election results had started to flow in.
Gold Four-Hour Price Chart
Chart prepared by James Stanley; data derived from Tradingview
--- written by James Stanley, Senior Strategist


Open an account in minutes
Experience award-winning platforms with fast and secure execution, and enjoy tight spreads from 0.5 pts on FX and 0.3 pts on indices.
Economic calendar
Web Trader platform
Our sophisticated web-based platform is packed with features.
Related articles
ASX 200 Outlook: A Rates Trade Disguised as a Stock Market?
Australian bond futures have exhibited a far stronger relationship with the ASX 200 than Wall Street over recent months. Now both markets are displaying remarkably similar price structures.

AUD/USD Bulls Fight Back After Australian Jobs Shock
AUD/USD has been hit by another ugly Australian employment report, sending RBA rate hike expectations sharply lower. Yet the relationships driving the currency have shifted since quarter-end, and improving risk appetite could provide the fuel for a recovery.

Bitcoin Bulls Eye Weekend Bounce as Nasdaq Finds Support
Bitcoin bulls eye a weekend bounce as Nasdaq finds support, BTC holds $80k and bullish reversal signals emerge alongside stronger correlations.

This report is intended for general circulation only. It should not be construed as a recommendation, or an offer (or solicitation of an offer) to buy or sell any financial products. The information provided does not take into account your specific investment objectives, financial situation or particular needs. Before you act on any recommendation that may be contained in this report, independent advice ought to be sought from a financial adviser regarding the suitability of the investment product, taking into account your specific investment objectives, financial situation or particular needs.
StoneX Financial Pte. Ltd., may distribute reports produced by its respective foreign entities or affiliates within the StoneX group of companies or third parties pursuant to an arrangement under Regulation 32C of the Financial Advisers Regulations. Where the report is distributed to a person in Singapore who is not an accredited investor, expert investor or an institutional investor (as defined in the Securities Futures Act), StoneX Financial Pte. Ltd. accepts legal responsibility to such persons for the contents of the report only to the extent required by law. Singapore recipients should contact StoneX Financial Pte. Ltd. at 6826 9988 for matters arising from, or in connection with the report.
In the case of all other recipients of this report, to the extent permitted by applicable laws and regulations neither StoneX Financial Pte. Ltd. nor its associated companies will be responsible or liable for any loss or damage incurred arising out of, or in connection with, any use of the information contained in this report and all such liability is hereby expressly disclaimed. No representation or warranty is made, express or implied, that the content of this report is complete or accurate.
StoneX Financial Pte. Ltd. is not under any obligation to update this report.
Trading CFDs carries a high level of risk that may not be suitable for some investors. Consider your investment objectives, level of experience, financial resources, risk appetite and other relevant circumstances carefully. The possibility exists that you could lose some or all of your investments, including your initial deposits. If in doubt, please seek independent expert advice. Visit www.forex.com/en-sg/terms-and-policies for the complete Risk Disclosure Statement.