





Gold Price Outlook: Can Bearish Technical Setup and June Weakness Align?
Gold's rally may be running out of steam, with bearish reversal patterns and historically weak June seasonality pointing to a potential pullback.
Share this:

Over the past few weeks, I’ve noted that gold’s almighty rally is showing signs of exhaustion on the higher timeframes. Not only has price action delivered several twists and turns since its latest all-time high (ATH) in April, but the weekly charts show overlapping candles, and a Rickshaw Man doji formed on the monthly chart in May.
Moreover, May marked the first month since November that bulls failed to push gold prices above the prior month’s high. While none of this guarantees a strong bearish reversal, it does at least signal a clear change in the character of price action compared with the almost parabolic rally seen since January.
Only time will tell whether bears will be treated to a larger decline or simply lulled into another bear trap. But for now, a near-term bearish setup may have surfaced on gold’s daily chart to keep them occupied.
View related analysis:
- Gold Outlook: Seasonal Weakness and Fading Momentum Hint at June Pullback
- Japanese Yen Slides: USD/JPY, AUD/JPY Rally on Risk Optimism
- USD Net Shorts Hit Record as AUD Bears Rise, CAD and EUR Gain – COT Report
- AUD/USD Weekly Forecast: Fed Decision and Australian Jobs Eyed
View related analysis:
- Gold Outlook: Seasonal Weakness and Fading Momentum Hint at June Pullback
- Japanese Yen Slides: USD/JPY, AUD/JPY Rally on Risk Optimism
- USD Net Shorts Hit Record as AUD Bears Rise, CAD and EUR Gain – COT Report
- AUD/USD Weekly Forecast: Fed Decision and Australian Jobs Eyed
Gold Bearish Reversal Pattern Forms Near May High
A two-bar bearish reversal pattern (dark cloud cover) has formed on the gold daily chart, signalling a potential swing high for gold prices. That it occurred at the May high adds further weight to the case for at least a minor pullback — potentially toward the $3,313 support level.
The potential for a larger gold price correction, such as a double zig-zag, remains in play while gold holds beneath the May high. This corrective pattern implies another ABC move lower, which brings the $3,000–$3,031 support zone into focus. However, such a deeper retracement would likely require a strong risk-on environment. For now, the bias remains for a pullback toward $3,313, with the outlook to be refined as gold market conditions evolve.
Gold Futures Eye Support Near $3,340–$3,355 on 1-Hour Chart
The 1-hour chart shows gold is attempting to carve out a swing low above $3,400, currently trading around its weekly pivot point. The RSI (14) has rebounded from oversold territory and formed a small bullish divergence, suggesting that a minor bounce may be due.
Gold bears could look to fade into minor moves within Tuesday’s range, maintaining a bearish bias while prices remain beneath Monday’s high. Note that the weekly S1 pivot at $3,354.70 aligns just above two high-volume nodes (HVNs), making the $3,340–$3,355 zone a potential near-term support level — just above the key $3,313 swing low.
Gold June Seasonality Shows Lowest Win Rate of the Year
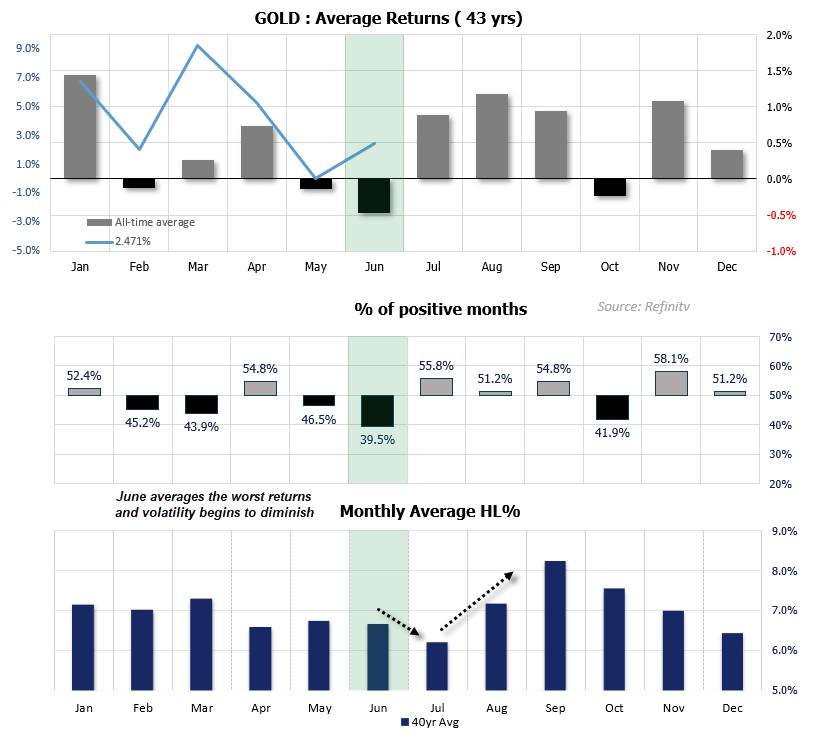
It is also worth noting Gold has averaged the strongest negative monthly return in June, using futures data over the past 43 years. Gold has also closed lower 60.5% of the time in June which is the lowest win rate of 39.5% compared to any other month in the year.
-- Written by Matt Simpson
Follow Matt on Twitter @cLeverEdge
How to trade with City Index
You can trade with City Index by following these four easy steps:
- Open an account, or log in if you’re already a customer
• Open an account in the UK
• Open an account in Australia
• Open an account in Singapore
- Search for the market you want to trade in our award-winning platform
- Choose your position and size, and your stop and limit levels
- Place the trade
Related tags:


Open an account in minutes
Experience award-winning platforms with fast and secure execution, and enjoy tight spreads from 0.5 pts on FX and 0.3 pts on indices.
Economic calendar
Web Trader platform
Our sophisticated web-based platform is packed with features.
Related articles

Gold forecast: XAU/USD continues to coil as support holds again
Gold is being pulled in two directions by the same macro force: inflation. Persistent price pressures should, in theory, strengthen demand for the metal as a store of value. But if inflation proves sticky enough to keep central banks hawkish, the resulting rise in real and nominal yields makes gold less attractive at the margin.


Swiss Franc Technical Outlook: USD/CHF Reversal Puts Major Support in Focus 10 21 2026
USD/CHF bears are looking to build on last week’s sharp reversal, with a looming support test threatening the broader recovery.


Nasdaq 100 forecast: Stocks rebound ahead of more earnings
European indices recovered from a weaker start to turn positive by mid-morning trade, although US futures were still nursing small losses. Global indices were looking to add to their gains from the day before. Investors are weighing up encouraging earnings from SpaceX and Super Micro against elevated oil prices, which are limiting the upside for risk assets. We have more tech earnings coming up today which could shape the near-term Nasdaq 100 forecast.
This report is intended for general circulation only. It should not be construed as a recommendation, or an offer (or solicitation of an offer) to buy or sell any financial products. The information provided does not take into account your specific investment objectives, financial situation or particular needs. Before you act on any recommendation that may be contained in this report, independent advice ought to be sought from a financial adviser regarding the suitability of the investment product, taking into account your specific investment objectives, financial situation or particular needs.
StoneX Financial Pte. Ltd., may distribute reports produced by its respective foreign entities or affiliates within the StoneX group of companies or third parties pursuant to an arrangement under Regulation 32C of the Financial Advisers Regulations. Where the report is distributed to a person in Singapore who is not an accredited investor, expert investor or an institutional investor (as defined in the Securities Futures Act), StoneX Financial Pte. Ltd. accepts legal responsibility to such persons for the contents of the report only to the extent required by law. Singapore recipients should contact StoneX Financial Pte. Ltd. at 6826 9988 for matters arising from, or in connection with the report.
In the case of all other recipients of this report, to the extent permitted by applicable laws and regulations neither StoneX Financial Pte. Ltd. nor its associated companies will be responsible or liable for any loss or damage incurred arising out of, or in connection with, any use of the information contained in this report and all such liability is hereby expressly disclaimed. No representation or warranty is made, express or implied, that the content of this report is complete or accurate.
StoneX Financial Pte. Ltd. is not under any obligation to update this report.
Trading CFDs carries a high level of risk that may not be suitable for some investors. Consider your investment objectives, level of experience, financial resources, risk appetite and other relevant circumstances carefully. The possibility exists that you could lose some or all of your investments, including your initial deposits. If in doubt, please seek independent expert advice. Visit www.forex.com/en-sg/terms-and-policies for the complete Risk Disclosure Statement.