







Japanese Yen Slides: USD/JPY, AUD/JPY Rally on Risk Optimism
The Japanese yen slumped on Monday as risk sentiment improved on Israel–Iran ceasefire hopes. With the BOJ expected to hold steady, traders are watching USD/JPY and AUD/JPY for potential bullish breakouts.
Share this:

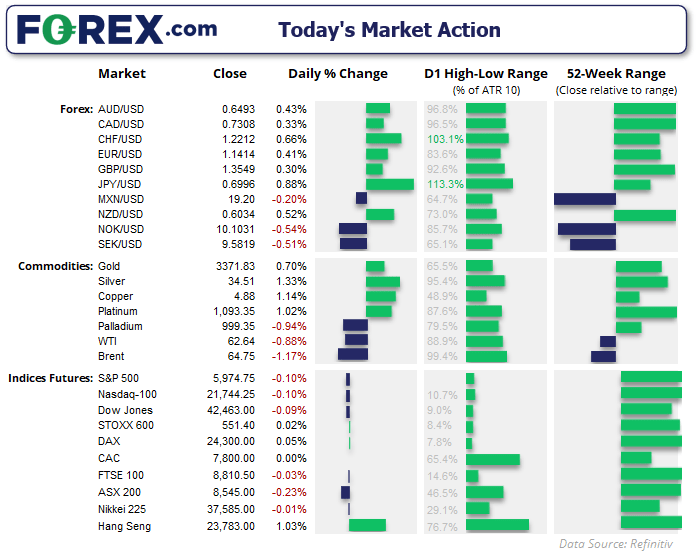
Hopes of a ceasefire between Israel and Iran sparked a bout of risk-on trade late on Monday, which essentially saw a reversal of many of the moves heading into the weekend. Safe-haven currencies lost their appeal in exchange for risk assets.
Wall Street futures were higher, led by the Nasdaq 100 and S&P 500 – both forming bullish engulfing candles and closing just off last week’s highs. The Dow Jones was the laggard, though it managed to recoup around two thirds of Friday’s selloff.
A 2-bar bearish reversal (dark cloud cover) formed on gold futures at the may high. Should sentiment continue to improve, it could allow for a deeper pullback from current levels and revives the potential for a ‘double zig zag’ move and to break below 3120.
WTI crude oil fell -1.7% after failing to take out Friday’s high by a cats whisker. Like gold, crude oil shows the potential to retrace further against last week’s rally should the ceasefire hold and sentiment continue to improve.
View related analysis:
View related analysis:
- USD Net Shorts Hit Record as AUD Bears Rise, CAD and EUR Gain – COT Report
- AUD/USD Weekly Forecast: Fed Decision and Australian Jobs Eyed
- WTI Crude Oil Surges, AUD/JPY Slides After Israel’s “Pre-Emptive Strike” on Iran
- USD/JPY Outlook: Japanese Yen Gains as Risk-Off Mood Lifts Safe Havens
Japanese Yen Drops on Ceasefire Hopes as Traders Eye BOJ and FOMC Decisions
The Japanese yen (JPY) and The Swiss franc (JPY) were the weakest currencies. Traders are seemingly looking past today’s BOJ interest rate decision, with markets pricing in ~90% chance of them holding rates at 0.5%. A recent Reuters poll revealed that the BOJ will hike rates to 0.75% by the end of Q1, maintain their current pace of bond purchases today with a small minority expecting that pace to slow by April. Ultimately, nothing major is expected to be announced by the BOJ today, which allowed the Japanese yen to broadly weaken amid a risk-on environment.
- EUR/JPY formed a bullish engulfing day and rose to an 11-month high
- GBP/JPY posted a marginal break above the May high to reach its most bullish level since early January
- CAD/JPY reached a 4-month high
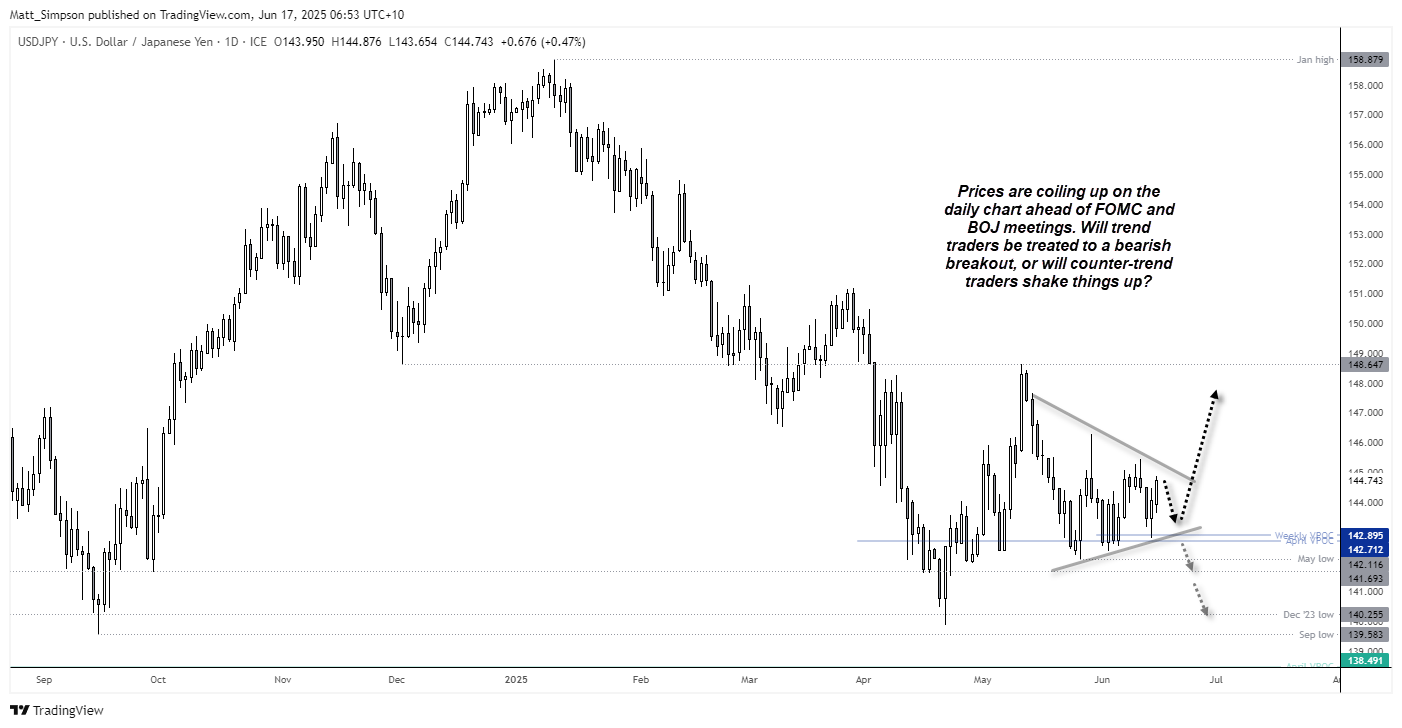
- USD/JPY rose for a second day, though remains within a coiling pattern on the daily chart
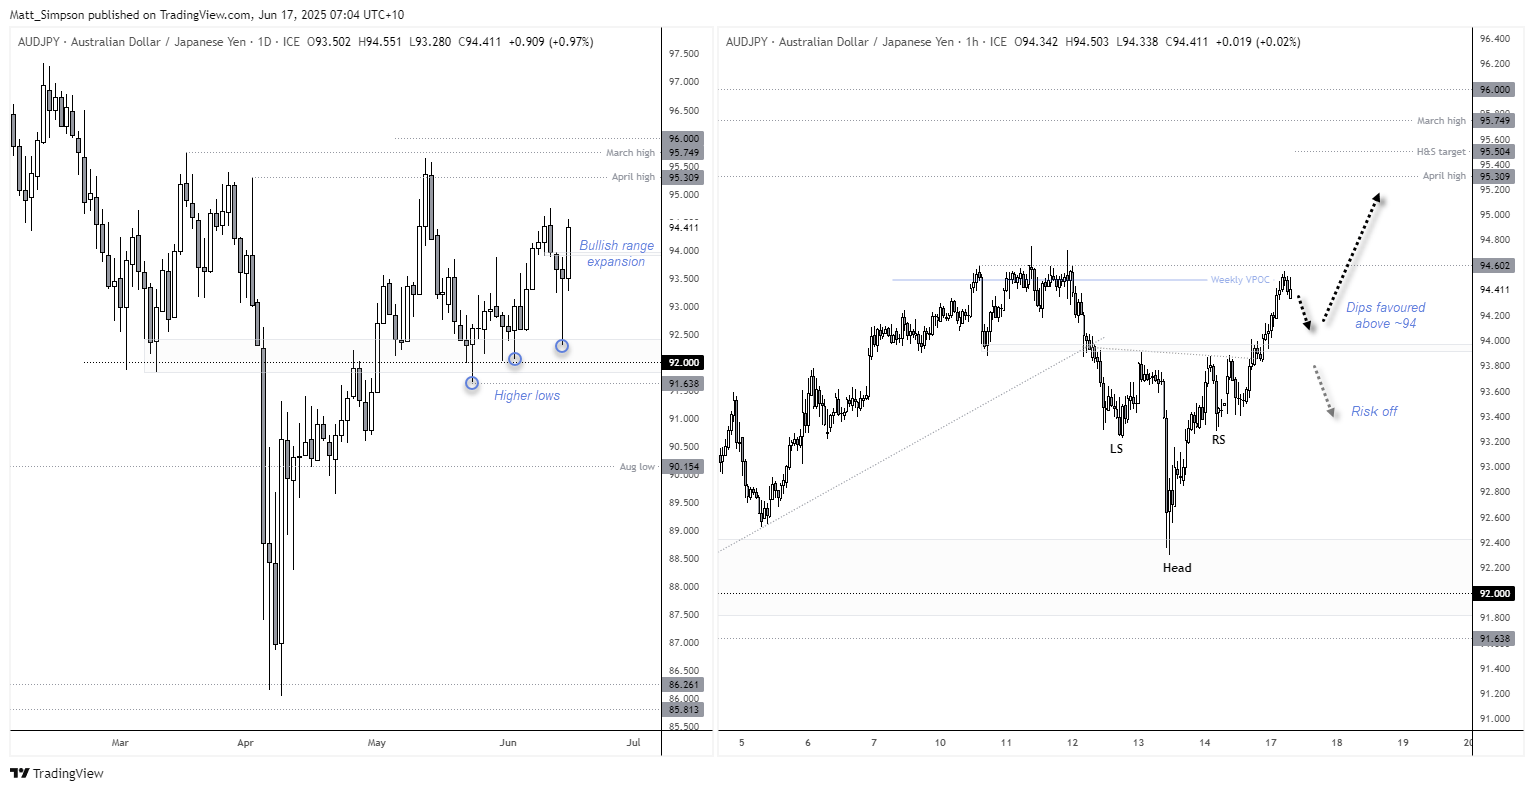
- AUD/JPY snapped a 3-day losing streak and saw bullish range expansion after a bullish hammer on the daily charts
USD/JPY Technical Analysis: US Dollar vs Japanese Yen
The main observation on USD/JPY is coiling nature of prices on the daily chart, with its contracting series of lower highs and higher lows suggesting a breakout is building (one way or the other). Trend traders and the asset managers who are at a record-level of net-short exposure are no doubt vying for a classic bearish breakout. Yet countertrend traders could point to a ‘sentiment extreme’ on the US dollar index futures market and point out that USD/JPY is indeed holding key support levels, to build a case of a bullish breakout.
With the upcoming FOMC meeting, a period of lower volatility is also plausible — potentially keeping USD/JPY confined within the past two days' range. Still, my bias leans toward a bullish breakout. This view is based on expectations that the Fed won’t deliver an overly dovish message, a ceasefire is on the horizon, the impact of Trump’s trade war headlines has diminished, and sentiment in US dollar and Japanese yen futures markets has reached near-term extremes.
AUD/JPY Technical Analysis: Australian Dollar vs Japanese Yen
The risk-on tone helped AUD/JPY snap a 3-day losing streak and provide a prominent day of bullish-range expansion. The Fact that AUD/JPY sprang higher from a bullish pinbar, whose lower wick formed a higher low above the 92 support level, adds to the bullish case in my view.
A move to at least to the 95 handle seems within easy reach, with the April high (95.30), March high (95.75) and 96 handle also making viable targets for bulls.
The 1-hour chart shows AUD/JPY has broken out of an inverted head and shoulders (H&S) reversal pattern, which suggest an upside target of 95.50 if successful. Dips towards ~94 are favoured for an eventual bullish break above last week’s high. A move beneath the neckline assumes a risk-off environment and invalidates the near-term bullish bias.
Economic Events in Focus (AEST / GMT+10)
08:45: NZD FPI (MoM) (May) (NZD/USD)
12:30: JPY BoJ Monetary Policy Statement (USD/JPY)
13:00: JPY BoJ Interest Rate Decision – forecast: 0.50%, prior: 0.50% (USD/JPY, Nikkei 225)
16:30: JPY BoJ Press Conference (JPY crosses)
18:00: USD IEA Monthly Report (Crude oil, energy stocks)
19:00: GBP 5-Year Treasury Gilt Auction (GBP/USD)
19:00: EUR ZEW Surveys (Jun): German Current Conditions, Economic Sentiment, Eurozone Sentiment (EUR/USD, DAX)
22:00: NZD Global Dairy Trade Price Index (NZD/USD)
22:00: USD Milk Auctions (Dairy futures)
22:30: USD Retail Sales & Inflation Metrics (May) – including Core Retail Sales, Retail Sales (YoY), Import/Export Price Indexes, Retail Control (S&P 500, USD crosses)
22:30: CAD Foreign Securities Purchases (Apr) (USD/CAD)
22:55: USD Redbook (YoY) (USD)
23:15: USD Industrial & Manufacturing Production (May) – including Capacity Utilization (USD)
00:00: USD Business Inventories, NAHB Housing Market Index, Retail Inventories Ex Auto (Apr/Jun) (USD)
03:00: USD 5-Year TIPS Auction & Atlanta Fed GDPNow (Q2) (Treasuries, USD)
View the full economic calendar
View the full economic calendar
-- Written by Matt Simpson
Follow Matt on Twitter @cLeverEdge
How to trade with City Index
You can trade with City Index by following these four easy steps:
- Open an account, or log in if you’re already a customer
• Open an account in the UK
• Open an account in Australia
• Open an account in Singapore
- Search for the market you want to trade in our award-winning platform
- Choose your position and size, and your stop and limit levels
- Place the trade
Related tags:



Open an account in minutes
Experience award-winning platforms with fast and secure execution, and enjoy tight spreads from 0.5 pts on FX and 0.3 pts on indices.
Economic calendar
Web Trader platform
Our sophisticated web-based platform is packed with features.
Related articles

USD/JPY Forecast: Is Rising Japanese Inflation Supporting the Yen?
As the trading week comes to an end, one of the most relevant developments in the FX market has been the renewed strength of the Japanese yen. This can be seen in the recent performance of USD/JPY, which has fallen nearly 1.0% over the last two trading sessions, highlighting a meaningful recovery in the Japanese currency against the U.S. dollar.


Silver forecast: metals liquidation drags XAG/USD into $50-55 support
Silver has broken its July low and slipped into a long-term support zone as the selling in precious metals deepens. The chart shows where the metal could bottom, and next week's Fed decision may decide whether it does.


Australian Dollar Forecast: AUD/USD Support Reversal Sparks Monthly Range Breakout 10 23 2026
A sharp reversal off key support has fueled the AUD/USD recovery, with resistance now in focus ahead of next week’s Fed decision and Australian CPI.
This report is intended for general circulation only. It should not be construed as a recommendation, or an offer (or solicitation of an offer) to buy or sell any financial products. The information provided does not take into account your specific investment objectives, financial situation or particular needs. Before you act on any recommendation that may be contained in this report, independent advice ought to be sought from a financial adviser regarding the suitability of the investment product, taking into account your specific investment objectives, financial situation or particular needs.
StoneX Financial Pte. Ltd., may distribute reports produced by its respective foreign entities or affiliates within the StoneX group of companies or third parties pursuant to an arrangement under Regulation 32C of the Financial Advisers Regulations. Where the report is distributed to a person in Singapore who is not an accredited investor, expert investor or an institutional investor (as defined in the Securities Futures Act), StoneX Financial Pte. Ltd. accepts legal responsibility to such persons for the contents of the report only to the extent required by law. Singapore recipients should contact StoneX Financial Pte. Ltd. at 6826 9988 for matters arising from, or in connection with the report.
In the case of all other recipients of this report, to the extent permitted by applicable laws and regulations neither StoneX Financial Pte. Ltd. nor its associated companies will be responsible or liable for any loss or damage incurred arising out of, or in connection with, any use of the information contained in this report and all such liability is hereby expressly disclaimed. No representation or warranty is made, express or implied, that the content of this report is complete or accurate.
StoneX Financial Pte. Ltd. is not under any obligation to update this report.
Trading CFDs carries a high level of risk that may not be suitable for some investors. Consider your investment objectives, level of experience, financial resources, risk appetite and other relevant circumstances carefully. The possibility exists that you could lose some or all of your investments, including your initial deposits. If in doubt, please seek independent expert advice. Visit www.forex.com/en-sg/terms-and-policies for the complete Risk Disclosure Statement.