



Gold & Silver Outlook: Dollar Strength Caps Haven Rally Amid Hormuz Risks
Gold and silver prices retreat amid Middle East tensions and Iranian regime escalation, as profit taking and US dollar strength pressure precious metals near key technical levels.
Share this:

Key Events
- Gold and silver dropped on profit taking and dollar strength, briefly below 5300 and 85 respectively, before reversing back above those zones on persistent haven demand.
- Strait of Hormuz closure risks raise inflationary pressures and prolong rate-hold expectations, strengthening the dollar and temporarily stabilizing the precious metals surge, alongside tighter margin requirements.
Amid the storm of regime headlines and regional battles, drawdowns in haven assets may fuel narratives of potential de-escalation. However, several dynamics within this escalation may be contributing to the short-term pullback.
I wrote about the Strait of Hormuz in yesterday’s article, WTI Forecast: Hormuz Risks, Aramco Impact, and OPEC Supply highlighting its significance as a narrow passage hosting 20–30% of global crude and energy flows. Its current constrained activity, rising insurance premiums, and ongoing attacks, has already lifted crude prices above 72 and Brent above 80. That, in turn, revives inflation risks, strengthens the dollar, and reinforces rate-hold expectations, capping gains in currencies and precious metals.

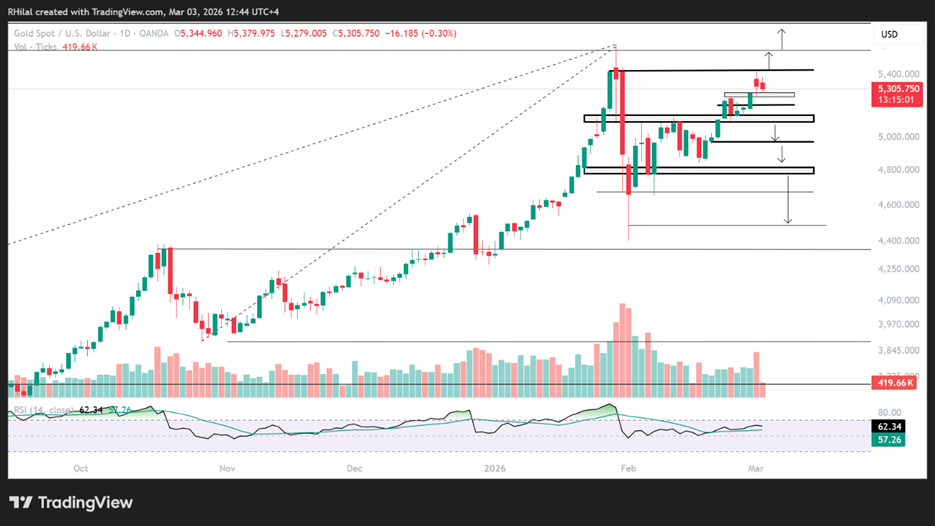
Gold had already gained roughly 22% year-to-date before the latest escalation, reaching an all-time high near 5,600 in late January before correcting. We are still trading within that corrective phase, rather than witnessing a structural shift or regime outcome. The Iranian regime has been consolidating power for over 40 years; any outcome is unlikely to unfold smoothly.
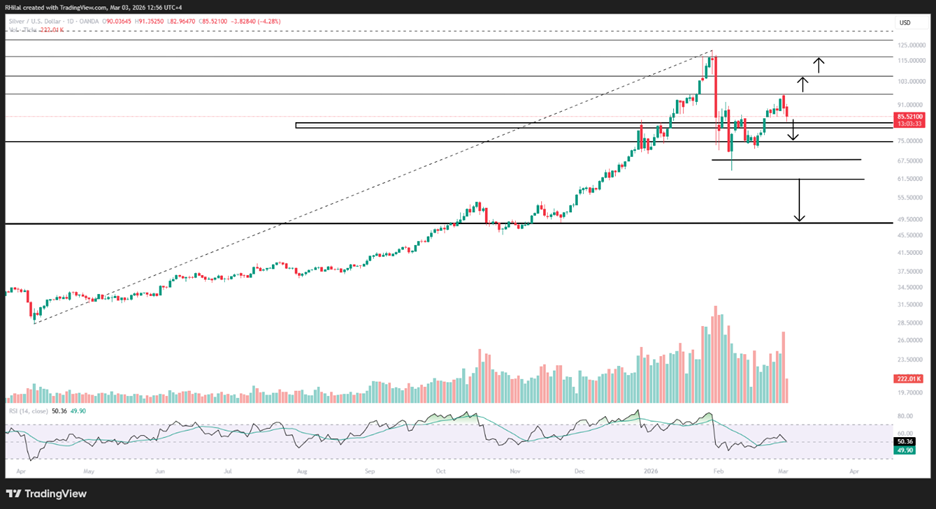
Silver’s story is more complex. Its industrial exposure adds another layer: if conflict begins to weigh on global manufacturing and trade, silver’s demand outlook deteriorates even as its haven appeal rises. That dual nature makes it choppier than gold during conflict cycles. Yesterday’s move reflected that volatility, with a steeper drawdown of over 10%, briefly testing 83 before recovering above the 85 zone.
This short dip could simply be a breather, unless a close emerges below key levels, supporting a deeper corrective phase.
If the Strait situation escalates further, or energy inflation feeds into broader CPI prints, gold maintains a clear macro path in line with inflation-hedging flows.
Technical Analysis: Quantifying Uncertainties
Gold Outlook: Daily Time Frame – Log Scale
Source: Trading view
On the daily log scale, gold’s price action reflects indecision, with small-bodied candles near the 5,400 zone following a prior gap higher, raising short-term exhaustion risks.
A weekly close above 5,430 would reopen upside momentum toward 5,600 and potentially the 6,000 threshold.
On the downside, extended profit taking with a close below the 5,280–5,250 zone exposes 5,100 as the next rebound area. A deeper corrective structure would bring 4,970, 4,780, and 4,670 into focus. The steeper scenario revisits the February 2026 low near 4,380 from a medium-term perspective.
Silver Outlook: Daily Time Frame – Log Scale
Source: Trading view
Comparing silver’s corrective cycle to its April 2025–January 2026 rally of over 300%, a critical support zone aligns with the RSI holding near neutral.
A sustained break below the 82–80 support exposes 75, 68, 60, and potentially 48. The 48 level aligns with a 46-year trendline connecting consecutive highs since 1980 prior to the 2025 breakout, marking a structurally significant dip-buying zone. These levels also align with key Fibonacci retracements of the April–January advance.
On the upside, if a new impulsive wave develops, resistance levels stand near 92, 96, 106, and 120 — before projecting toward new historical thresholds near 130 and 200.
Given the elevated risk of sharp swings across gold and silver, confirmation from higher time-frame structures remains essential in navigating daily volatility and headline-driven moves.
Written by Razan Hilal, CMT
Follow on X: @Rh_waves
Related tags:



Open an account in minutes
Experience award-winning platforms with fast and secure execution, and enjoy tight spreads from 0.5 pts on FX and 0.3 pts on indices.
Economic calendar
Web Trader platform
Our sophisticated web-based platform is packed with features.
Related articles
Gold Breaks Down on Descending Triangle, Sets Up $4k Test
Gold started last week with a strong sell-off but from that move a bounce developed. Bulls could not hold on through the weekly close, however, and the bearish structure remains in-place for XAU/USD.

Gold Update: XAU/USD Remains Under Pressure Even After the NFP Report
As the trading week comes to an end, weakness around gold price action remains evident in the short term. This can be seen in the performance of the past two sessions, where the metal has declined by approximately 0.3%. Although the move has not been particularly aggressive, it highlights that buying pressure continues to struggle to regain control of the market.


Dow Jones Forecast: DJIA rises after weaker jobs data
U.S. stocks are rising after weaker-than-expected U.S. jobs data saw markets rein in rate hike expectations.

This report is intended for general circulation only. It should not be construed as a recommendation, or an offer (or solicitation of an offer) to buy or sell any financial products. The information provided does not take into account your specific investment objectives, financial situation or particular needs. Before you act on any recommendation that may be contained in this report, independent advice ought to be sought from a financial adviser regarding the suitability of the investment product, taking into account your specific investment objectives, financial situation or particular needs.
StoneX Financial Pte. Ltd., may distribute reports produced by its respective foreign entities or affiliates within the StoneX group of companies or third parties pursuant to an arrangement under Regulation 32C of the Financial Advisers Regulations. Where the report is distributed to a person in Singapore who is not an accredited investor, expert investor or an institutional investor (as defined in the Securities Futures Act), StoneX Financial Pte. Ltd. accepts legal responsibility to such persons for the contents of the report only to the extent required by law. Singapore recipients should contact StoneX Financial Pte. Ltd. at 6826 9988 for matters arising from, or in connection with the report.
In the case of all other recipients of this report, to the extent permitted by applicable laws and regulations neither StoneX Financial Pte. Ltd. nor its associated companies will be responsible or liable for any loss or damage incurred arising out of, or in connection with, any use of the information contained in this report and all such liability is hereby expressly disclaimed. No representation or warranty is made, express or implied, that the content of this report is complete or accurate.
StoneX Financial Pte. Ltd. is not under any obligation to update this report.
Trading CFDs carries a high level of risk that may not be suitable for some investors. Consider your investment objectives, level of experience, financial resources, risk appetite and other relevant circumstances carefully. The possibility exists that you could lose some or all of your investments, including your initial deposits. If in doubt, please seek independent expert advice. Visit www.forex.com/en-sg/terms-and-policies for the complete Risk Disclosure Statement.