



Index in Focus: China A50
Poor economic data combined with the constant closing and re-opening of certain areas in China have the China A50 on its heels.
Share this:

The news out of China lately hasn’t been great. China’s Caixin Manufacturing PMI released earlier today for August was 49.5 vs 50.2 expected and 50.4 in July. This is the lowest level since May and puts the Chinese economy under the 50 expansion/contraction level. Major reasons for the lower print include power outages and the ongoing closing and opening of cities due to Covid. Speaking of Covid, China has placed its 4th largest city, Chengdu, under lockdown. This region accounts for 1.75% of the country’s GDP. In addition, parts of China’s largest tech hub, Shenzhen, had several areas placed under lockdown. To make matters worse, the US has ordered Nvidia and AMD to halt sending AI chips to China and Russia. This all comes on the heels of poor economic data, including Industrial Production and Retail Sales. In addition, China’s housing sector has been plummeting due to failing property developers. Can the China A50 recover as it approaches its May lows?
The China A50 had been moving in a symmetrical triangle since mid-June 2015. However, on July 3rd, 2020, the index busted through the top of the wedge near 14700 and by February 18th, 2021, it reached an all-time high of 20603.10! Since then, the index has been moving lower, as concerns of inflation, an economic slowdown, and an increase of Covid cases began to move through China. Price tested the previously mentioned top trendline of the long-term triangle numerous times, only to finally come crashing through it on March 7th, 2022. Since May 2021, the China A50 has also been moving lower in a downward sloping channel, reaching a near-term low of 13186 in mid-March of this year.

Source: Tradingview, Stone X
Trade the China A50 now: Login or open a new account!
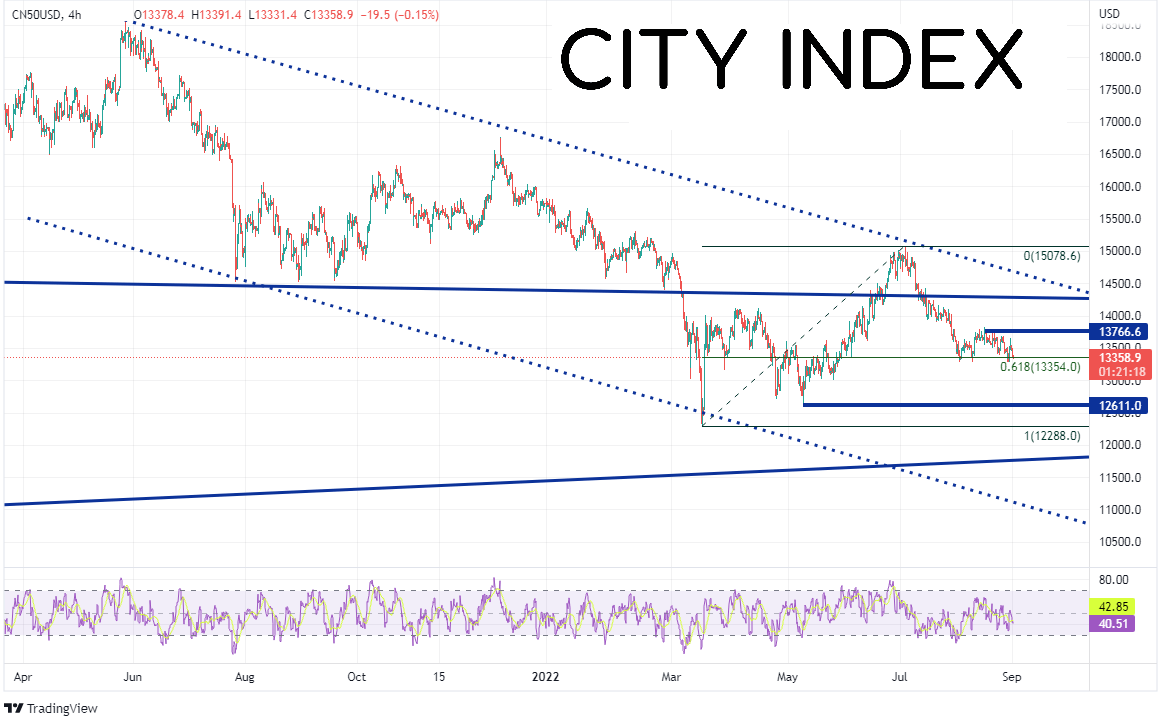
On a 240-minute timeframe, the China A50 is trading near the 61.8% Fibonacci retracement level from the lows of March 15th to the highs of July 5th, near 13354. If price breaks, the next level of horizontal support is at 12611, and then the lows of March 15th at 12288. Below there, price can fall to the bottom trendline of the long-term triangle near 11800. However, if the support holds and price bounces, first resistance is at highs from August 15th at 12766.6. Above there, resistance is at the top trendline of the previously mentioned long term triangle near 14270 and then the top, downward sloping trendline from the channel near 14690.

Source: Tradingview, Stone X
Poor economic data combined with the constant closing and re-opening of certain areas in China have the China A50 on its heels. Will the Index continue to move lower? The 61.8% Fibonacci retracement level from March 15th to July 5th may be the key level to watch!
Learn more about forex trading opportunities.
The news out of China lately hasn’t been great. China’s Caixin Manufacturing PMI released earlier today for August was 49.5 vs 50.2 expected and 50.4 in July. This is the lowest level since May and puts the Chinese economy under the 50 expansion/contraction level. Major reasons for the lower print include power outages and the ongoing closing and opening of cities due to Covid. Speaking of Covid, China has placed its 4th largest city, Chengdu, under lockdown. This region accounts for 1.75% of the country’s GDP. In addition, parts of China’s largest tech hub, Shenzhen, had several areas placed under lockdown. To make matters worse, the US has ordered Nvidia and AMD to halt sending AI chips to China and Russia. This all comes on the heels of poor economic data, including Industrial Production and Retail Sales. In addition, China’s housing sector has been plummeting due to failing property developers. Can the China A50 recover as it approaches its May lows?
The China A50 had been moving in a symmetrical triangle since mid-June 2015. However, on July 3rd, 2020, the index busted through the top of the wedge near 14700 and by February 18th, 2021, it reached an all-time high of 20603.10! Since then, the index has been moving lower, as concerns of inflation, an economic slowdown, and an increase of Covid cases began to move through China. Price tested the previously mentioned top trendline of the long-term triangle numerous times, only to finally come crashing through it on March 7th, 2022. Since May 2021, the China A50 has also been moving lower in a downward sloping channel, reaching a near-term low of 13186 in mid-March of this year.

Source: Tradingview, Stone X
Trade the China A50 now: Login or Open a new account!
• Open an account in the UK
• Open an account in Australia
• Open an account in Singapore
On a 240-minute timeframe, the China A50 is trading near the 61.8% Fibonacci retracement level from the lows of March 15th to the highs of July 5th, near 13354. If price breaks, the next level of horizontal support is at 12611, and then the lows of March 15th at 12288. Below there, price can fall to the bottom trendline of the long-term triangle near 11800. However, if the support holds and price bounces, first resistance is at highs from August 15th at 12766.6. Above there, resistance is at the top trendline of the previously mentioned long term triangle near 14270 and then the top, downward sloping trendline from the channel near 14690.
Source: Tradingview, Stone X
Poor economic data combined with the constant closing and re-opening of certain areas in China have the China A50 on its heels. Will the Index continue to move lower? The 61.8% Fibonacci retracement level from March 15th to July 5th may be the key level to watch!
Learn more about forex trading opportunities.
Related tags:


Open an account in minutes
Experience award-winning platforms with fast and secure execution, and enjoy tight spreads from 0.5 pts on FX and 0.3 pts on indices.
Economic calendar
Web Trader platform
Our sophisticated web-based platform is packed with features.
Related articles
ASX 200 Outlook: A Rates Trade Disguised as a Stock Market?
Australian bond futures have exhibited a far stronger relationship with the ASX 200 than Wall Street over recent months. Now both markets are displaying remarkably similar price structures.

AUD/USD Bulls Fight Back After Australian Jobs Shock
AUD/USD has been hit by another ugly Australian employment report, sending RBA rate hike expectations sharply lower. Yet the relationships driving the currency have shifted since quarter-end, and improving risk appetite could provide the fuel for a recovery.

Bitcoin Bulls Eye Weekend Bounce as Nasdaq Finds Support
Bitcoin bulls eye a weekend bounce as Nasdaq finds support, BTC holds $80k and bullish reversal signals emerge alongside stronger correlations.

This report is intended for general circulation only. It should not be construed as a recommendation, or an offer (or solicitation of an offer) to buy or sell any financial products. The information provided does not take into account your specific investment objectives, financial situation or particular needs. Before you act on any recommendation that may be contained in this report, independent advice ought to be sought from a financial adviser regarding the suitability of the investment product, taking into account your specific investment objectives, financial situation or particular needs.
StoneX Financial Pte. Ltd., may distribute reports produced by its respective foreign entities or affiliates within the StoneX group of companies or third parties pursuant to an arrangement under Regulation 32C of the Financial Advisers Regulations. Where the report is distributed to a person in Singapore who is not an accredited investor, expert investor or an institutional investor (as defined in the Securities Futures Act), StoneX Financial Pte. Ltd. accepts legal responsibility to such persons for the contents of the report only to the extent required by law. Singapore recipients should contact StoneX Financial Pte. Ltd. at 6826 9988 for matters arising from, or in connection with the report.
In the case of all other recipients of this report, to the extent permitted by applicable laws and regulations neither StoneX Financial Pte. Ltd. nor its associated companies will be responsible or liable for any loss or damage incurred arising out of, or in connection with, any use of the information contained in this report and all such liability is hereby expressly disclaimed. No representation or warranty is made, express or implied, that the content of this report is complete or accurate.
StoneX Financial Pte. Ltd. is not under any obligation to update this report.
Trading CFDs carries a high level of risk that may not be suitable for some investors. Consider your investment objectives, level of experience, financial resources, risk appetite and other relevant circumstances carefully. The possibility exists that you could lose some or all of your investments, including your initial deposits. If in doubt, please seek independent expert advice. Visit www.forex.com/en-sg/terms-and-policies for the complete Risk Disclosure Statement.