



Is the South African Rand pointing to a new low in Gold?
The South African Rand and Gold have a strong positive correlation. Therefore, when one of these assets moves in one direction, the other asset is likely to follow in the same direction.
Share this:

The South African Rand and Gold have a strong positive correlation. Therefore, when one of these assets moves in one direction, the other asset is likely to follow in the same direction. That being said, USD/ZAR and Gold (XAU/USD) have a strong negative correlation; this is, when one asset moves in one direction the other asset is likely to move in the opposite direction.
Below is a chart of USD/ZAR. The bottom panel of the chart shows the correlation coefficient between USD/ZAR and Gold. The current correlation on the daily timeframe is -0.94. A reading of -1.00 is a perfect negative correlation, which means that 2 assets move in opposite directions 100% of the time. A reading of -0.94 is pretty close!

Source: Tradingview, Stone X
The daily candlestick chart in the chart above shows the price action of USD/ZAR. The pair has been moving higher in an upward sloping channel since forming a double bottom in early April. On September 1st, USD/ZAR broke to its highest level since September 28th, 2020 and above the 61.8% Fibonacci retracement level from the highs of April 2020 to the lows of June 2021, near 17.1846. With USD/ZAR moving to new near-term highs, does this mean that Gold will follow? However, also notice in the middle panel of the above that the RSI is diverging with price, as the RSI makes three lower highs in overbought territory. This is an indication that USD/ZAR may be ready for a pullback.
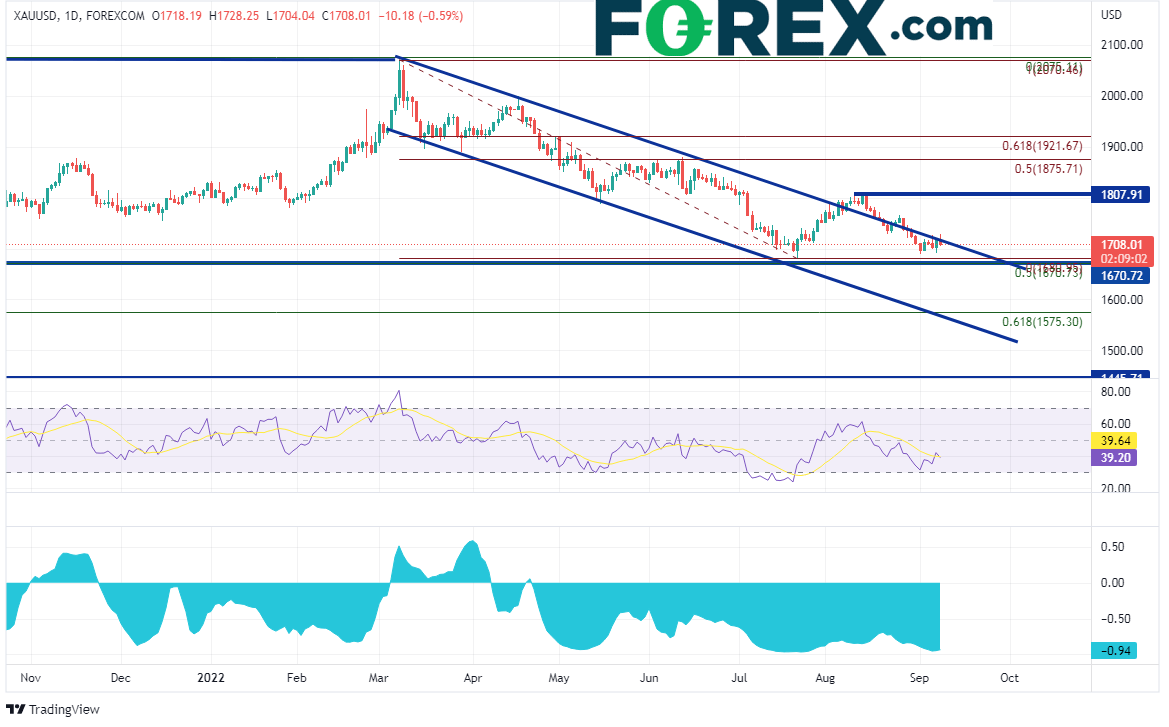
Gold (XAU/USD) has been moving lower in an organized channel since testing the all-time highs at 2075.11 on March 8th. On July 21st, Gold tested the recent low’s of 1670, only to bounce from there. Price traded above the top trendline of the descending channel, only to be stopped at 1807.91 and move lower. Since then, price has been oscillating around the top trendline of the channel, reaching as low as 1688.84. Is it time for Gold to move lower below 1670? That level acts as first support. Not only has that level held after being tested six times since the coronavirus pandemic in March 2020, but it is also the 50% retracement level from the lows of April 2019 t0 the highs in August 2020. Below there, price can move to the 61.8% Fibonacci retracement from that same timeframe near 1575.30, then the bottom trendline of the channel near 1560. However, if Gold holds the 1670 level for a seventh time, first resistance is at the highs form August 10th at 1807.91. Above there, Gold can move the 50% retracement level and the 61.8% Fibonacci retracement level from the highs of March 8th to the lows of July 21st at 1875.71 and 1921.67, respectively.
Source: Tradingview, Stone X
So will Gold finally take out the lows of 1670, which has been tested half a dozen times since the beginning of the coronavirus pandemic. If USD/ZAR continues to move higher, and if the negative correlation remains strong, then probabilities suggest that it should!
The South African Rand and Gold have a strong positive correlation. Therefore, when one of these assets moves in one direction, the other asset is likely to follow in the same direction. That being said, USD/ZAR and Gold (XAU/USD) have a strong negative correlation; this is, when one asset moves in one direction the other asset is likely to move in the opposite direction.
Below is a chart of USD/ZAR. The bottom panel of the chart shows the correlation coefficient between USD/ZAR and Gold. The current correlation on the daily timeframe is -0.94. A reading of -1.00 is a perfect negative correlation, which means that 2 assets move in opposite directions 100% of the time. A reading of -0.94 is pretty close!

Source: Tradingview, Stone X
The daily candlestick chart in the chart above shows the price action of USD/ZAR. The pair has been moving higher in an upward sloping channel since forming a double bottom in early April. On September 1st, USD/ZAR broke to its highest level since September 28th, 2020 and above the 61.8% Fibonacci retracement level from the highs of April 2020 to the lows of June 2021, near 17.1846. With USD/ZAR moving to new near-term highs, does this mean that Gold will follow? However, also notice in the middle panel of the above that the RSI is diverging with price, as the RSI makes three lower highs in overbought territory. This is an indication that USD/ZAR may be ready for a pullback.
Trade USD/ZAR now: Login or Open a new account!
• Open an account in the UK
• Open an account in Australia
• Open an account in Singapore
Gold (XAU/USD) has been moving lower in an organized channel since testing the all-time highs at 2075.11 on March 8th. On July 21st, Gold tested the recent low’s of 1670, only to bounce from there. Price traded above the top trendline of the descending channel, only to be stopped at 1807.91 and move lower. Since then, price has been oscillating around the top trendline of the channel, reaching as low as 1688.84. Is it time for Gold to move lower below 1670? That level acts as first support. Not only has that level held after being tested six times since the coronavirus pandemic in March 2020, but it is also the 50% retracement level from the lows of April 2019 t0 the highs in August 2020. Below there, price can move to the 61.8% Fibonacci retracement from that same timeframe near 1575.30, then the bottom trendline of the channel near 1560. However, if Gold holds the 1670 level for a seventh time, first resistance is at the highs form August 10th at 1807.91. Above there, Gold can move the 50% retracement level and the 61.8% Fibonacci retracement level from the highs of March 8th to the lows of July 21st at 1875.71 and 1921.67, respectively.

Source: Tradingview, Stone X
Trade Gold now: Login or Open a new account!
• Open an account in the UK
• Open an account in Australia
• Open an account in Singapore
So will Gold finally take out the lows of 1670, which has been tested half a dozen times since the beginning of the coronavirus pandemic. If USD/ZAR continues to move higher, and if the negative correlation remains strong, then probabilities suggest that it should!
Learn more about forex trading opportunities.
Related tags:


Open an account in minutes
Experience award-winning platforms with fast and secure execution, and enjoy tight spreads from 0.5 pts on FX and 0.3 pts on indices.
Economic calendar
Web Trader platform
Our sophisticated web-based platform is packed with features.
Related articles
USD/JPY weekly outlook: Quarter turn scrambles rates regime
USD/JPY’s tight relationship with front-end US rates broke down sharply last week, but quarter-turn flows and positioning suggest the disconnect may prove temporary.

Gold Update: XAU/USD Remains Under Pressure Even After the NFP Report
As the trading week comes to an end, weakness around gold price action remains evident in the short term. This can be seen in the performance of the past two sessions, where the metal has declined by approximately 0.3%. Although the move has not been particularly aggressive, it highlights that buying pressure continues to struggle to regain control of the market.


USD/CAD forecast: rally could accelerate above June highs at 1.4250
USD/CAD recovered quickly after weaker US jobs data, keeping the bullish trend in focus. A move above the June highs could accelerate the rally as inflation keeps the Fed under pressure.

This report is intended for general circulation only. It should not be construed as a recommendation, or an offer (or solicitation of an offer) to buy or sell any financial products. The information provided does not take into account your specific investment objectives, financial situation or particular needs. Before you act on any recommendation that may be contained in this report, independent advice ought to be sought from a financial adviser regarding the suitability of the investment product, taking into account your specific investment objectives, financial situation or particular needs.
StoneX Financial Pte. Ltd., may distribute reports produced by its respective foreign entities or affiliates within the StoneX group of companies or third parties pursuant to an arrangement under Regulation 32C of the Financial Advisers Regulations. Where the report is distributed to a person in Singapore who is not an accredited investor, expert investor or an institutional investor (as defined in the Securities Futures Act), StoneX Financial Pte. Ltd. accepts legal responsibility to such persons for the contents of the report only to the extent required by law. Singapore recipients should contact StoneX Financial Pte. Ltd. at 6826 9988 for matters arising from, or in connection with the report.
In the case of all other recipients of this report, to the extent permitted by applicable laws and regulations neither StoneX Financial Pte. Ltd. nor its associated companies will be responsible or liable for any loss or damage incurred arising out of, or in connection with, any use of the information contained in this report and all such liability is hereby expressly disclaimed. No representation or warranty is made, express or implied, that the content of this report is complete or accurate.
StoneX Financial Pte. Ltd. is not under any obligation to update this report.
Trading CFDs carries a high level of risk that may not be suitable for some investors. Consider your investment objectives, level of experience, financial resources, risk appetite and other relevant circumstances carefully. The possibility exists that you could lose some or all of your investments, including your initial deposits. If in doubt, please seek independent expert advice. Visit www.forex.com/en-sg/terms-and-policies for the complete Risk Disclosure Statement.