



Japanese Yen Price Action Setups Across USD/JPY, GBP/JPY, EUR/JPY, CAD/JPY
USD/JPY, EUR/JPY, GBP/JPY and CAD/JPY pull back as Japanese yen strength builds. Key technical levels and price action setups to watch.
Share this:

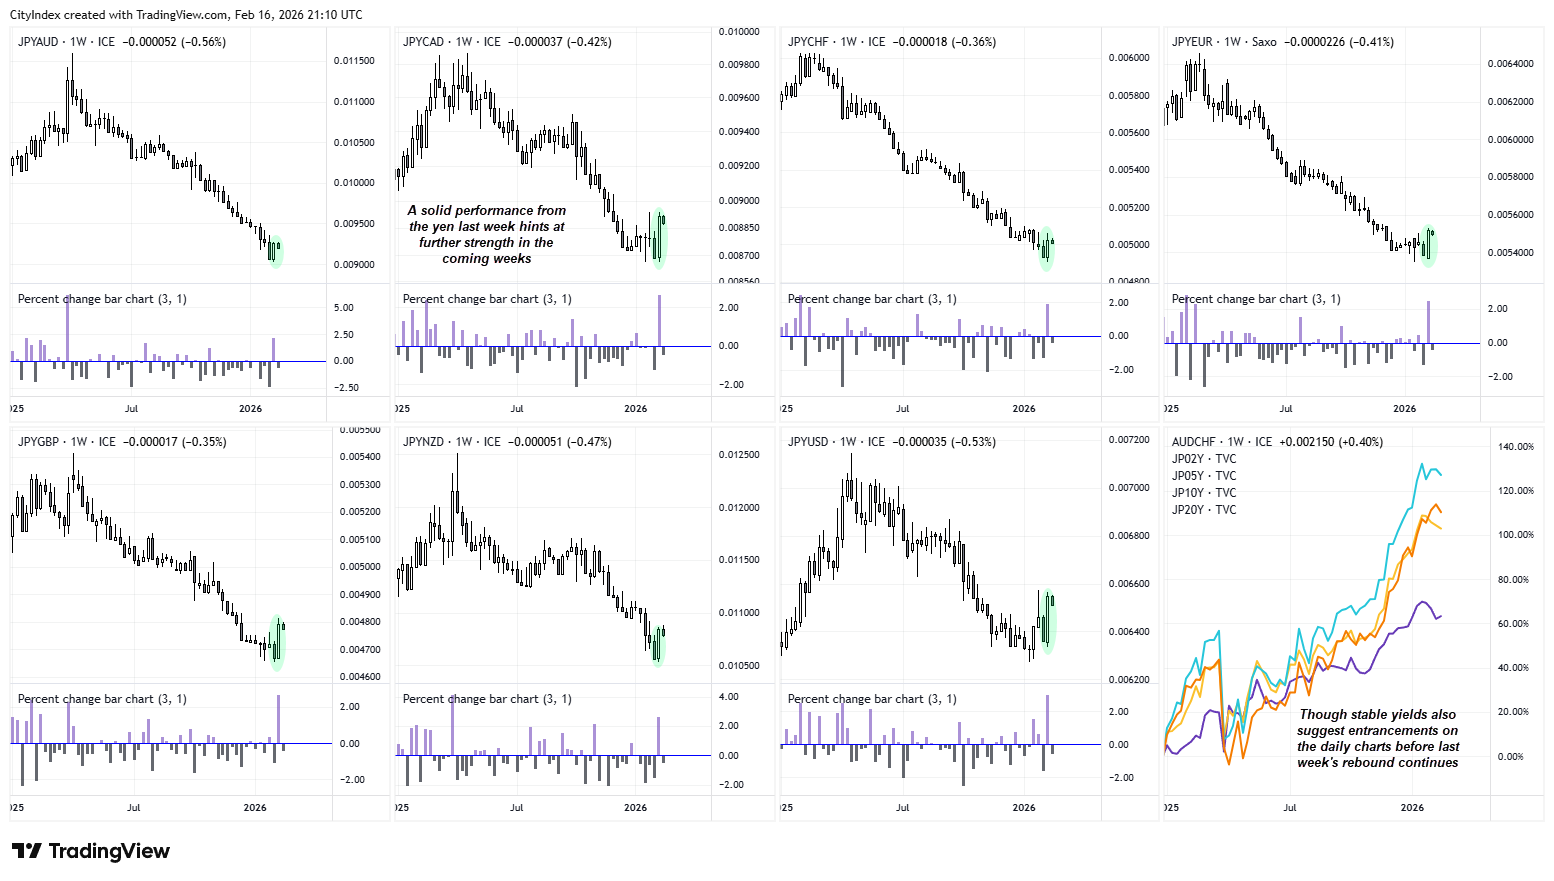
Last week’s -3% decline marked the worst week since November for USD/JPY. However, the move was driven more by a resurgence in Japanese yen strength than outright US dollar weakness. The yen gained broadly against all FX majors, with weekly charts littered with bullish engulfing and outside candles, hinting at a potential inflection point in favour of further yen strength.
View related analysis:
View related analysis:
That said, the rise in Japan’s bond yields has stalled as bond prices stabilised, which could take some wind out of bullish yen sails in the near term. Even so, with clear price action signals of yen strength on the weekly charts, asset managers holding net-long exposure in futures, and the potential for deeper pullbacks on equity indices, the core bias remains for a stronger Japanese yen in the coming weeks once minor retracements on the daily charts have played out.
Source: TradingView
Japanese Yen Technical Setups on USD/JPY, GBP/JPY, EUR/JPY and CAD/JPY
USD/JPY Technical Analysis: US Dollar vs Japanese Yen
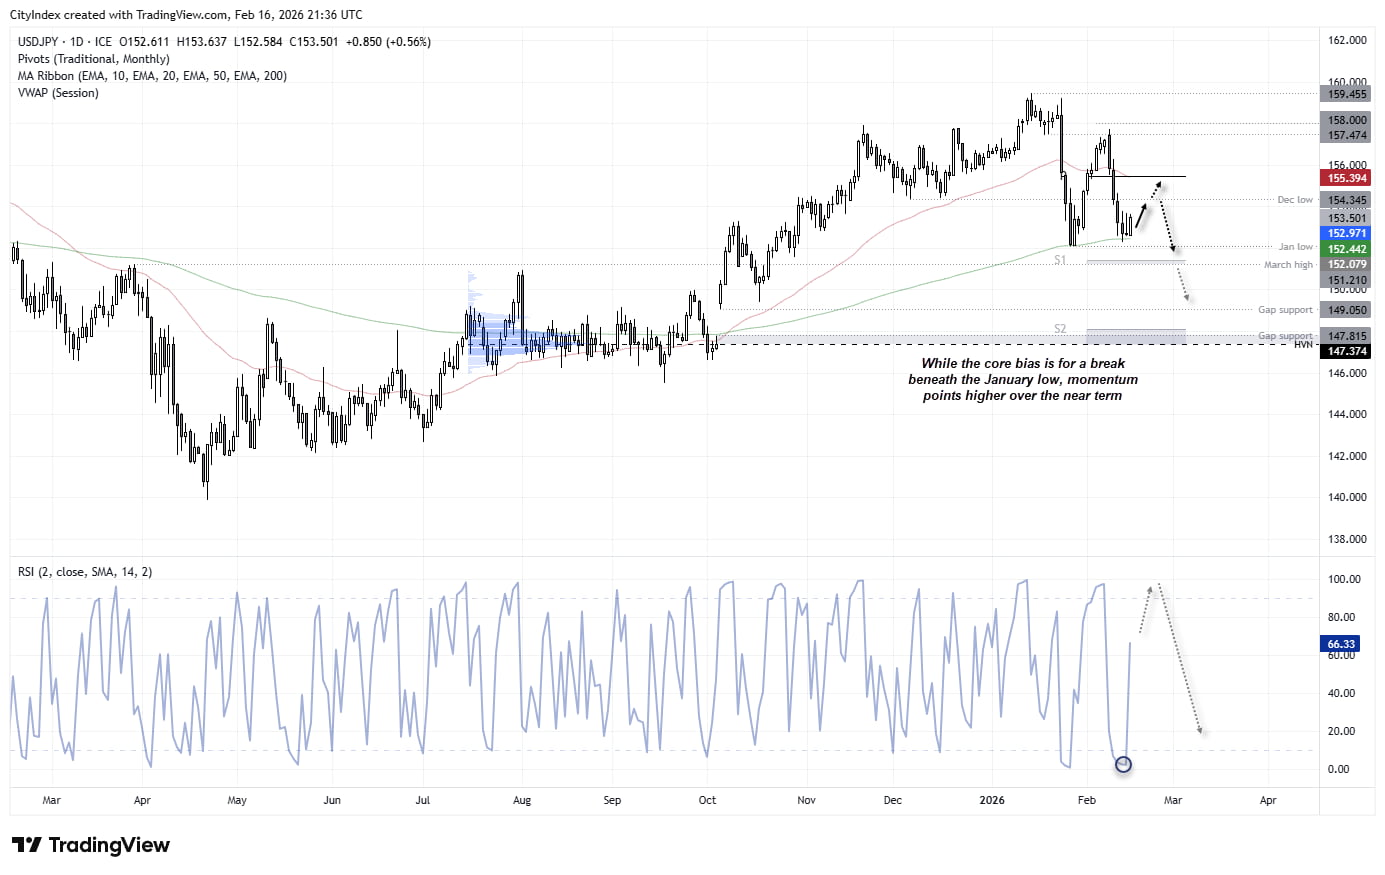
Monday’s bounce in USD/JPY was almost inevitable. Thursday’s long lower wick failed to test the January low, before an end-of-day reversal saw USD/JPY close back above the 200-day EMA. Friday’s inverted pin bar then failed to retest the 200-day EMA, paving the way for a start-of-week retracement against last week’s sharp selloff.
Price action has also formed a three-day bullish reversal pattern (morning star), hinting at a deeper retracement in the near term for USD/JPY and a temporary pullback in Japanese yen strength.
USD/JPY bulls could target a move towards the 154 handle or the December low at 154.34 while price holds above Monday’s low. Rallies within Monday’s range may also be considered in pursuit of a more favourable reward-to-risk ratio. A sustained break above 154.50 would open the door for a deeper retracement towards the monthly pivot at 155.43 and potentially the 156 handle.
That said, I will be watching for signs of a lower high on the daily timeframe once the anticipated bounce in USD/JPY runs its course, as that would suggest the broader bullish bias for the Japanese yen remains intact. Bears may then look for another attempt at the January low.
However, a decisive break beneath the March high would be required before assuming a much deeper USD/JPY selloff is underway. A break of 150 would bring the 149 handle into focus near gap support, followed by lower gap support around 147.50, close to the high-volume node (HVN) at 147.38.
Source: TradingView
EUR/JPY, GBP/JPY and CAD/JPY Extend Pullback as Japanese Yen Strength Builds
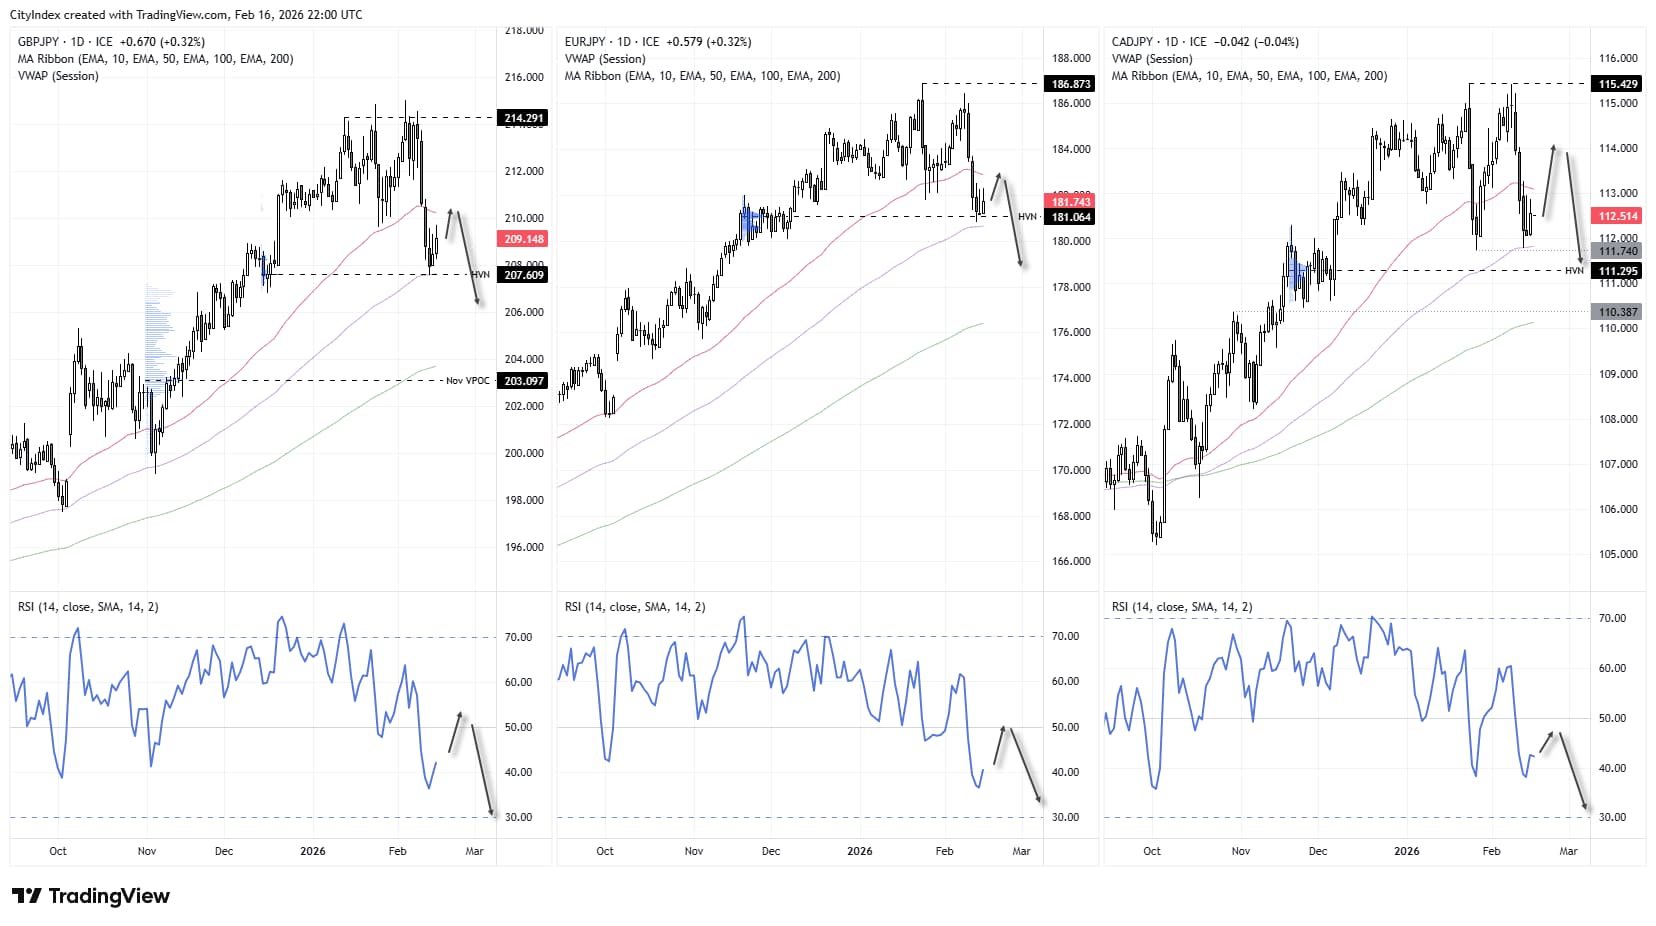
EUR/JPY, GBP/JPY and CAD/JPY have each fallen more than 3% from their respective cycle highs as Japanese yen strength accelerates across the FX majors. While there are subtle structural differences between these yen crosses, all three remain trapped between their 50-day and 100-day EMAs. My bias is for last week’s bearish momentum in EUR/JPY, GBP/JPY and CAD/JPY to extend lower once minor near-term retracements have played out.
Source: TradingView
GBP/JPY Technical Analysis
GBP/JPY bulls repeatedly failed to sustain a breakout above 215 before momentum turned decisively lower, reinforcing broader Japanese yen strength. Prices have since found interim support around the 207.6 high-volume node (HVN) near the 208 handle.
While short-term momentum is attempting to lift GBP/JPY back towards 210 and its 50-day EMA, I am sceptical that bulls can extend gains towards 212. Instead, I am on guard for a lower high to form, followed by a break beneath 207.6 and the 100-day EMA, which would strengthen the bearish GBP/JPY outlook.


EUR/JPY Technical Analysis
EUR/JPY has also found support at its HVN near 181.06, with price yet to test the 100-day EMA. However, the prior swing low has already been taken out, tilting risks in favour of further downside.
Bears may look to fade rallies towards the 50-day EMA, positioning for a sustained break below the 180 handle. Continued yen strength would likely keep EUR/JPY under pressure in the weeks ahead.


CAD/JPY Technical Analysis
CAD/JPY differs slightly in structure, as it has so far held above its prior swing low. This suggests bears may prefer to wait for a larger corrective bounce to improve reward-to-risk conditions.
A break above 113 or a sustained move above the 50-day EMA could open a run towards 114. However, unless CAD/JPY can reclaim higher resistance levels, the broader bias still favours Japanese yen strength reasserting itself and dragging the cross lower.
View the full economic calendar
View the full economic calendar
-- Written by Matt Simpson
Follow Matt on Twitter @cLeverEdge
How to trade with City Index
You can trade with City Index by following these four easy steps:
- Open an account, or log in if you’re already a customer
• Open an account in the UK
• Open an account in Australia
• Open an account in Singapore
- Search for the market you want to trade in our award-winning platform
- Choose your position and size, and your stop and limit levels
- Place the trade
Latest market news




Open an account in minutes
Experience award-winning platforms with fast and secure execution, and enjoy tight spreads from 0.5 pts on FX and 0.3 pts on indices.
Economic calendar
Web Trader platform
Our sophisticated web-based platform is packed with features.
Related articles
NZD/USD reversal case strengthens as Fed pricing cools
NZD/USD has triggered a bullish reversal after a punishing two-month decline, with less hawkish Fed pricing and an aggressive RBNZ rates path providing fuel for a rebound.
USD/CAD Knocked from Its Perch as US Dollar Rally Pauses for Breath
USD/CAD retreats from stretched highs as the US dollar rally cools, with softer yields, Canadian trade strength and crude oil in focus.
US Dollar Price Action Setups: EUR/USD, GBP/USD, USD/JPY, USD/CAD, Gold
The US Dollar hit a fresh yearly high and is currently testing above a major level, but EUR/USD has already pushed into extreme territory and that begs the question around continuation potential in each market. Meanwhile, USD/JPY retains bullish short-term structure.

This report is intended for general circulation only. It should not be construed as a recommendation, or an offer (or solicitation of an offer) to buy or sell any financial products. The information provided does not take into account your specific investment objectives, financial situation or particular needs. Before you act on any recommendation that may be contained in this report, independent advice ought to be sought from a financial adviser regarding the suitability of the investment product, taking into account your specific investment objectives, financial situation or particular needs.
StoneX Financial Pte. Ltd., may distribute reports produced by its respective foreign entities or affiliates within the StoneX group of companies or third parties pursuant to an arrangement under Regulation 32C of the Financial Advisers Regulations. Where the report is distributed to a person in Singapore who is not an accredited investor, expert investor or an institutional investor (as defined in the Securities Futures Act), StoneX Financial Pte. Ltd. accepts legal responsibility to such persons for the contents of the report only to the extent required by law. Singapore recipients should contact StoneX Financial Pte. Ltd. at 6826 9988 for matters arising from, or in connection with the report.
In the case of all other recipients of this report, to the extent permitted by applicable laws and regulations neither StoneX Financial Pte. Ltd. nor its associated companies will be responsible or liable for any loss or damage incurred arising out of, or in connection with, any use of the information contained in this report and all such liability is hereby expressly disclaimed. No representation or warranty is made, express or implied, that the content of this report is complete or accurate.
StoneX Financial Pte. Ltd. is not under any obligation to update this report.
Trading CFDs carries a high level of risk that may not be suitable for some investors. Consider your investment objectives, level of experience, financial resources, risk appetite and other relevant circumstances carefully. The possibility exists that you could lose some or all of your investments, including your initial deposits. If in doubt, please seek independent expert advice. Visit www.forex.com/en-sg/terms-and-policies for the complete Risk Disclosure Statement.