




Nasdaq 100 analysis: Goldilocks NFP takes NDX to 14-month highs
The Nasdaq 100 is at 14-month highs after the headline NFP reading beat expectations for the 15th straight month, coming in at 339K vs. just 193K eyed
Share this:
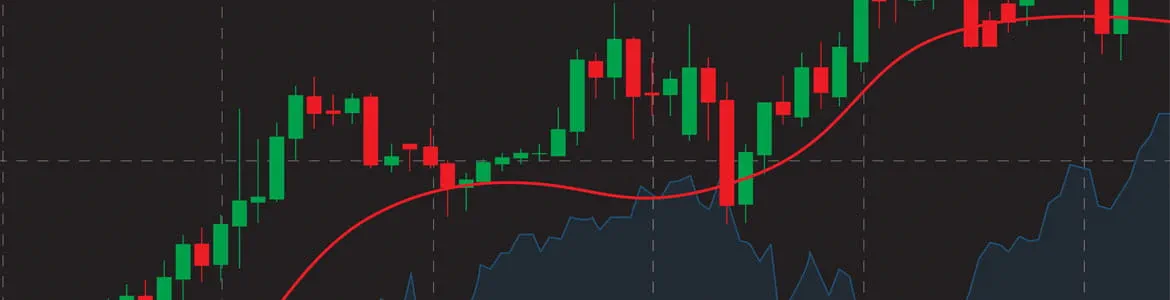
Nasdaq 100 takeaways
- A strong NFP report and the resolution of the debt ceiling drama has traders in a “risk on” mood.
- The Nasdaq 100 is breaking out above resistance to its highest level since last April.
- There is little in the way of meaningful resistance until above 15,000, though the index is overbought and may be vulnerable to a pause or pullback next week.
Nasdaq 100 fundamental analysis
Overnight, the US Senate voted 63-36 to approve the debt ceiling bill, sending it to President Biden’s desk for a perfunctory signature. Of course, the market had already priced in this development, and while the timeline got relatively tight at the end, traders never panicked throughout the ordeal, seeing through the politicking to inevitable conclusion.
Instead, economic data has taken to the fore this week, highlighted by this morning’s highly-anticipated non-farm payrolls report. For the 15th month in a row, the headline NFP reading beat expectations, coming in at 339K vs. just 193K eyed; the prior two months’ readings were also revised higher by nearly 100K jobs in aggregate.
Though the headline reading was stellar, some of the “below the hood” details of the NFP report were more mixed: The unemployment rate rose from 3.4% to 3.7%, and wages grew at 0.3% m/m, brining down the year-over-year rate to 4.3%. On balance, the US labor market clearly remains healthy, with perhaps some early signs that it may be cooling off slightly (if one were to squint!).
For chorus of Federal Reserve speakers who generally touted the merits of “skipping” a 25bps interest rate hike in June to gather more data, this month’s jobs report likely provides just enough latitude for the central bank to hold fire later this month, as long as the CPI report on June 13th comes in at or below expectations.
Today’s strong-but-not-worryingly-so jobs report falls in the “goldilocks zone” for risk appetite, taking indices like the S&P 500 and Nasdaq 100 to fresh year-to-date highs.
Nasdaq 100 technical analysis – NDX daily chart
Source: TradingView, StoneX
As the chart above shows, the Nasdaq 100 is building on yesterday’s gains to trade above the 14,500 level, its highest print since last April. Assuming it can finish the day and week near current levels, this week’s price action will represent a confirmed bullish break above the 61.8% Fibonacci retracement of the 2021-2022 bear market, leaving little in the way of resistance until confluence of previous highs and the 78.6% Fibonacci retracement above 15,000.
While the year-to-date trend and momentum clearly favor the bulls, readers should note that the 14-day RSI is well within overbought territory (> 70), suggesting the index may be vulnerable to a pause or pullback next week. Swing traders may prefer to buy dips toward the 14,000 area to join the established uptrend at a more favorable price.
-- Written by Matt Weller, Global Head of Research
Follow Matt on Twitter: @MWellerFX
How to trade with City Index
You can trade with City Index by following these four easy steps:
- Open an account, or log in if you’re already a customer
• Open an account in the UK
• Open an account in Australia
• Open an account in Singapore
- Search for the market you want to trade in our award-winning platform
- Choose your position and size, and your stop and limit levels
- Place the trade




Open an account in minutes
Experience award-winning platforms with fast and secure execution, and enjoy tight spreads from 0.5 pts on FX and 0.3 pts on indices.
Economic calendar
Web Trader platform
Our sophisticated web-based platform is packed with features.
Related articles

NFP Preview: Can the Jobs Report Overcome the Bond Market Meltdown Too?
Traders and economists expect the NFP report to show that the US created 90K net new jobs, with average hourly earnings rising 0.3% m/m (3.1% y/y) and the U3 unemployment rate at 4.1% - see what the leading indicators are suggesting!

Nasdaq 100 Forecast: NDX slips as Treasury yields keep rising
U.S. stocks are falling at the start of Q4, as gains in software stocks offset concerns over soaring Treasury yields. U.S. Treasury yields continue to rise, with the 10-year yield up 2 basis points at 5.31% and the 30-year at 5.66%, multi-decade highs.


Dow Jones forecast: Stock markets under pressure from multiple sources
When looking at the major tech-heavy US indices like the S&P 500 or the Nasdaq 100, you wouldn’t think that the stock market is particularly weak. Yet, beneath the surface, the market is far from healthy right now. Investors are evidently just piling into the big tech and AI names, and as a result, market breadth is deteriorating. Other indices like the small cap Russell 2000 and the Dow Jones are starting to reflect that weakness.

This report is intended for general circulation only. It should not be construed as a recommendation, or an offer (or solicitation of an offer) to buy or sell any financial products. The information provided does not take into account your specific investment objectives, financial situation or particular needs. Before you act on any recommendation that may be contained in this report, independent advice ought to be sought from a financial adviser regarding the suitability of the investment product, taking into account your specific investment objectives, financial situation or particular needs.
StoneX Financial Pte. Ltd., may distribute reports produced by its respective foreign entities or affiliates within the StoneX group of companies or third parties pursuant to an arrangement under Regulation 32C of the Financial Advisers Regulations. Where the report is distributed to a person in Singapore who is not an accredited investor, expert investor or an institutional investor (as defined in the Securities Futures Act), StoneX Financial Pte. Ltd. accepts legal responsibility to such persons for the contents of the report only to the extent required by law. Singapore recipients should contact StoneX Financial Pte. Ltd. at 6826 9988 for matters arising from, or in connection with the report.
In the case of all other recipients of this report, to the extent permitted by applicable laws and regulations neither StoneX Financial Pte. Ltd. nor its associated companies will be responsible or liable for any loss or damage incurred arising out of, or in connection with, any use of the information contained in this report and all such liability is hereby expressly disclaimed. No representation or warranty is made, express or implied, that the content of this report is complete or accurate.
StoneX Financial Pte. Ltd. is not under any obligation to update this report.
Trading CFDs carries a high level of risk that may not be suitable for some investors. Consider your investment objectives, level of experience, financial resources, risk appetite and other relevant circumstances carefully. The possibility exists that you could lose some or all of your investments, including your initial deposits. If in doubt, please seek independent expert advice. Visit www.forex.com/en-sg/terms-and-policies for the complete Risk Disclosure Statement.