




nikkei 225 further potential up move above 16560 1831272016
<p>Daily Outlook, Thurs 22 Sep 2016 (Click to enlarge chart) What happened earlier/yesterday The Japan 225 Index (proxy for the Nikkei 225 futures) has managed […]</p>
Share this:

Daily Outlook, Thurs 22 Sep 2016
What happened earlier/yesterday
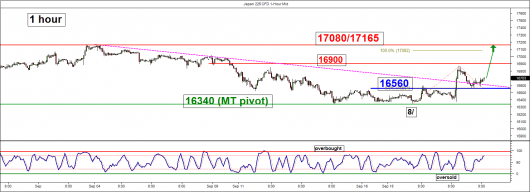
The Japan 225 Index (proxy for the Nikkei 225 futures) has managed to stage the strong expected rebound after it held above the 16340 medium-term pivotal support since Monday, 19 September 2016 and almost hit our short-term target/resistance at 16900 (printed a high of 16868) in the Asian session.
Please click on this link for a recap on our previous daily short-term technical outlook/strategy.
Yesterday’s up move seen in the Index has been reinforced by an “innovative” change in Bank of Japan’s latest monetary policy as BOJ has decided to target the shape JGB yield curve in relation with its existing QQE programme (quantitative & qualitative monetary easing) In addition, BOJ has pledged to keep the 10 year yield on the JGB “at around” 0%. This latest policy measure sparked a rally in banks stocks as the negative effects on banks’ profitability caused by negative longer term JGB yields (10 years & beyond) in the first half of 2016 has been negated.
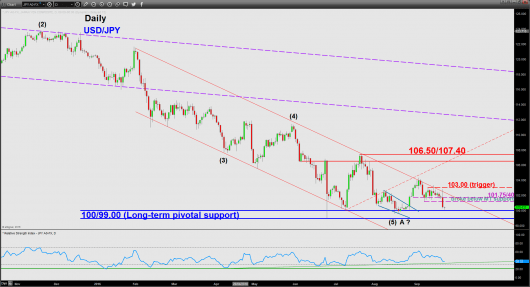
However, the USD/JPY did not received the “desire outcome” as the initial rally seen right after BOJ’s announcement from our 101.70/40 medium-term pivotal support was not sustained in the European session. The USD/JPY printed a high of 102.78 which is below the 103.00 upside trigger level before selling pressure came in to push it below 101.40. The latest monetary policy from the U.S. Fed did not help to revive the USD bulls even though in the FOMC statement indicated that confidence has returned to the U.S. economy and “external risks” have subsided. In addition, there were three voting Fed officials that dissented in favour of a 25bps hike which was the most since December 2014. Interestingly, one of the dissenters, a previous “dove” Eric Rosengren, head of the Boston Fed had turned more hawkish.
In our view, market participants are more fixated on the latest “dot plot” that highlights the path of future fed funds policy interest rates that now projected only 2 rate hikes in 2017, down from an initial 3 hikes projected earlier in the June meeting which lead to a sell-off in the USD across the board. However, it seems to us that market has failed to recognise the more “hawkish tone” depicted in the latest Fed’s monetary policy statement in relation with the previous statements since the start of 2016 and the number of dissenters among the voting committee members. Thus, we think that the current sell-off in the USD is likely to be short lived and the USD/JPY should be able to the hold above the key long-term pivotal support of 100.00/99.00 which suggests that the current up move seen in the Nikkei 225 can be sustained at least in the medium-term.
Key elements
- The daily (medium-term) RSI oscillator has staged a rebound from its key ascending trendline support and also surpassed the 50% level. These observations suggest that medium-term upside momentum has resurfaced which is likely to reinforce further up move in price action of the Index.
- The Index has also staged a bullish breakout above a former short-term descending trendline (depicted in dotted pink) from the recent 05 September 2016 minor swing high now turns pull-back resistance at around 16560.
- The afore mentioned pull-back support of 16560 also confluences with the former minor swing highs of 16 September/20 September 2016 and the 61.8% Fibonacci retracement of yesterday’s rally from 16375 low to 16868 high.
- The next short-term resistance stands at the 17080/17165 zone which is defined by the range top in place since 31 May 2015 and the 1.00 Fibonacci projection of the recent up move from 20 September 2016 low.
Key levels (1 to 3 days)
Pivot (key support): 16560
Resistances: 16900 & 17080/17165
Next supports: 16340 (medium-term pivot)
Conclusion
Maintain bullish bias. The pull-back seen in yesterday’s European session is likely to have seen its low and as long as the 16560 short-term pivotal support holds, the Index is likely to resume its up move towards 16900 before targeting 17080/17165 in the first step.
However, failure to hold above the 16560 short-term pivotal support may invalidate the preferred direct rise scenario for another slide to retest the 16340 medium-term pivotal support.
Charts are from City Index Advantage TraderPro & eSignal
Disclaimer
This report is intended for general circulation only. It should not be construed as a recommendation, or an offer (or solicitation of an offer) to buy or sell any financial products. The information provided does not take into account your specific investment objectives, financial situation or particular needs. Before you act on any recommendation that may be contained in this email, independent advice ought to be sought from a financial adviser regarding the suitability of the investment product, taking into account your specific investment objectives, financial situation or particular needs. All queries regarding the contents of this material are to be directed to City Index, a trading name of GAIN Capital Singapore Pte Ltd.
Trading CFDs and FX on margin carries a high level of risk that may not be suitable for some investors. Consider your investment objectives, level of experience, financial resources, risk appetite and other relevant circumstances carefully. The possibility exists that you could lose some or all of your investments, including your initial deposits. If in doubt, please seek independent expert advice. Visit cityindex.com.sg for the complete Risk Disclosure Statement.
Related tags:




Open an account in minutes
Experience award-winning platforms with fast and secure execution, and enjoy tight spreads from 0.5 pts on FX and 0.3 pts on indices.
Economic calendar
Web Trader platform
Our sophisticated web-based platform is packed with features.
Related articles
This report is intended for general circulation only. It should not be construed as a recommendation, or an offer (or solicitation of an offer) to buy or sell any financial products. The information provided does not take into account your specific investment objectives, financial situation or particular needs. Before you act on any recommendation that may be contained in this report, independent advice ought to be sought from a financial adviser regarding the suitability of the investment product, taking into account your specific investment objectives, financial situation or particular needs.
StoneX Financial Pte. Ltd., may distribute reports produced by its respective foreign entities or affiliates within the StoneX group of companies or third parties pursuant to an arrangement under Regulation 32C of the Financial Advisers Regulations. Where the report is distributed to a person in Singapore who is not an accredited investor, expert investor or an institutional investor (as defined in the Securities Futures Act), StoneX Financial Pte. Ltd. accepts legal responsibility to such persons for the contents of the report only to the extent required by law. Singapore recipients should contact StoneX Financial Pte. Ltd. at 6826 9988 for matters arising from, or in connection with the report.
In the case of all other recipients of this report, to the extent permitted by applicable laws and regulations neither StoneX Financial Pte. Ltd. nor its associated companies will be responsible or liable for any loss or damage incurred arising out of, or in connection with, any use of the information contained in this report and all such liability is hereby expressly disclaimed. No representation or warranty is made, express or implied, that the content of this report is complete or accurate.
StoneX Financial Pte. Ltd. is not under any obligation to update this report.
Trading CFDs carries a high level of risk that may not be suitable for some investors. Consider your investment objectives, level of experience, financial resources, risk appetite and other relevant circumstances carefully. The possibility exists that you could lose some or all of your investments, including your initial deposits. If in doubt, please seek independent expert advice. Visit www.forex.com/en-sg/terms-and-policies for the complete Risk Disclosure Statement.