


NZD/USD, NZD/JPY Forecast: RBNZ rate patience under pressure
Fresh Wage and inflation signals muddy the RBNZ rate outlook as Kiwi pairs eye 2026 highs.
Share this:

- Rate markets continue to price only modest liftoff risk before year-end
- Markets still doubt early RBNZ rate hikes
- NZD/USD consolidates, keeping broader upside bias intact
- NZD/JPY breakout holds, though follow-through remains limited
Summary
The New Zealand dollar continues to find support from a favourable macro backdrop, with rate differentials, buoyant risk appetite and strength across Asian markets helping to push the Kiwi higher. The latest ANZ Business Outlook survey only reinforces that constructive narrative, even if it complicates the RBNZ interest rate debate.
NZD/USD remains locked in consolidation following its January breakout, keeping the broader upside bias intact. NZD/JPY is attempting to build on Wednesday’s bullish breakout, though a lack of follow-through buying leaves the near-term picture less convincing.
As is often the case, the next meaningful move in Kiwi pairs may hinge less on domestic developments and more on swings in global risk appetite and external market drivers.
ANZ survey challenges clean disinflation narrative
The ANZ New Zealand Business Outlook for February doesn’t quite fit the confident disinflation narrative being pushed by the RBNZ, again raising doubts about whether the bank can really afford to wait until the end of the year before considering lifting interest rates.
Confidence and activity indicators remained firm in the latest survey, but it was the inflation readings that really caught the eye, questioning whether inflation will return to the bank’s 1-3% target band and hold there as forecast. Pricing intentions eased marginally to a net 53.3%, meaning significantly more firms still plan to raise prices than cut them.

Source: ANZ
Inflation expectations moved higher again, with the year ahead measure climbing to 2.93%. Perceptions on cost pressures were even more striking, with expectations hitting a net 79.4%, signalling an overwhelming majority of firms continue to see costs rising. Based on respondent averages, costs are seen lifting 2.54% over the next three months. Pipeline pressures are clearly not disappearing.
The outlook for wage pressures may also be stirring, with expected increases over the next year rising to 3.01%, the highest level since 2024. That shift sits uneasily with the RBNZ’s assessment that ample labour market slack should keep domestic price and wage pressures contained, with forward-looking indicators suggesting otherwise.
RBNZ pricing under scrutiny
While the survey carries no immediate implications for the cash rate, it does raise an uncomfortable question for rate markets: does pricing that still falls short of a fully discounted December hike genuinely reflect where the risks for liftoff now sit? Yes, the RBNZ may want to avoid doing anything ahead of the New Zealand election in early November, but swaps continue to assign only modest probabilities to earlier moves, with July priced near 10% and September closer to 40%.
That profile largely reflects dovishness from the RBNZ, who ultimately decide when to adjust policy. But it’s worth remembering the bank was late to begin easing after the pandemic reopening inflation surge cooled, resulting in a cutting cycle that proved far larger and faster than either policymakers or markets initially anticipated. After 325bps of easing, policy now sits firmly in stimulatory territory.
Who’s to say the same mistake isn’t being made again? Given trends across both hard and soft data, the balance of risks may be shifting. If anything, incoming signals suggest the debate may turn to whether liftoff arrives earlier than markets currently assume, not later.
Kiwi driven by rates and risk appetite
Movements in New Zealand’s rate outlook remain a key variable when assessing directional risks for Kiwi pairs. But as seen recently, rates alone rarely tell the full story.
Broader risk appetite continues to play an important supporting role. The resilience in cyclical assets, alongside ongoing strength in Asian markets, has helped to reinforce demand for growth-linked currencies, including the New Zealand dollar.
It’s a dynamic not dissimilar to what we’ve discussed previously with the Australian dollar. External forces, especially shifts in global risk sentiment and developments across Asia, are increasingly influencing Kiwi price action alongside the traditional interest rate channel.
NZD/USD consolidates within bullish pennant structure
Source: TradingView
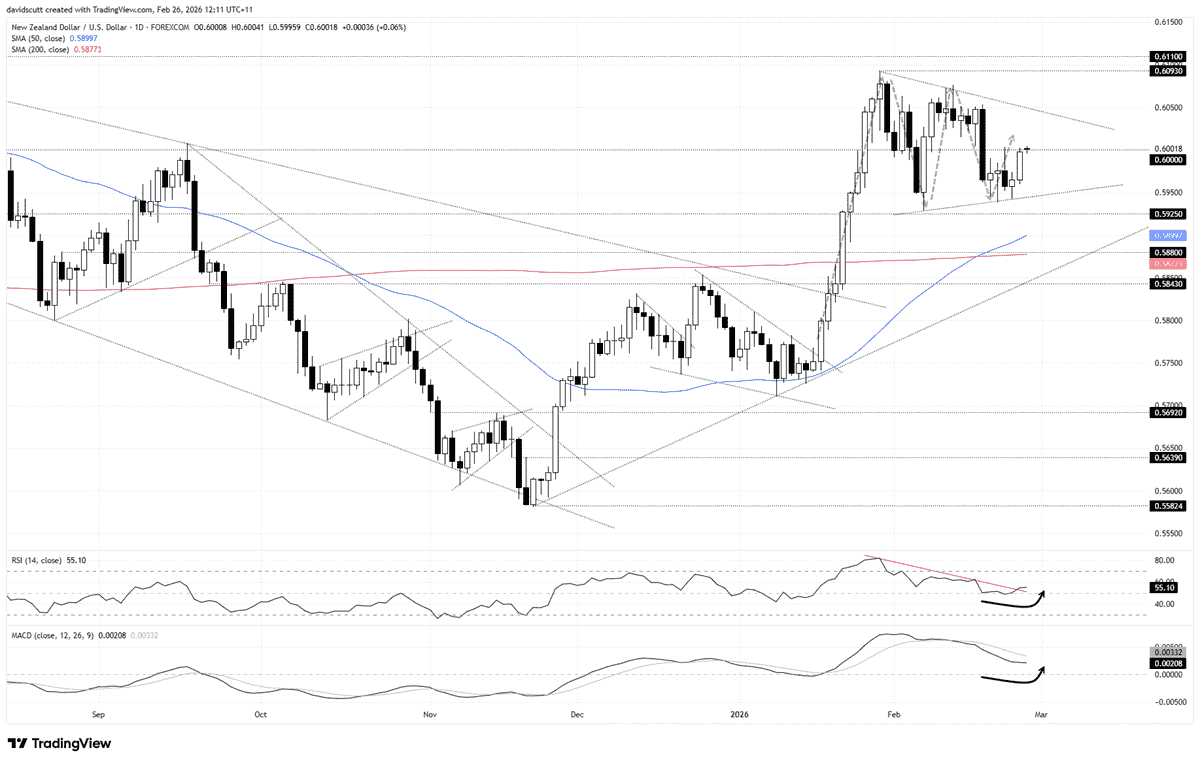
What we can see in NZD/USD is a period of consolidation after the January breakout stalled at .6093, with price now coiling within what resembles a bull pennant formation. While only limited touches have been seen so far, it implies we may soon see a resumption of the uptrend established in November last year when the RBNZ signalled it was all but done cutting rates. For now, the price sits between constricting resistance and support lines, leaving .6000 as the near-term focal point. That’s the level to build trade setups around depending on how price behaves.
With the sequence of lower highs in RSI (14) now broken and the indicator holding above 50, momentum signals hint directional risks may be starting to swing higher. While not yet confirmed by MACD, it too remains in positive territory despite crossing the signal line from above. Overall, the setup leans neutral with a dash of upside risk.
Wedge resistance is found around .6050. A clean break would bring a retest of the January highs into play, though .6075 warrants attention given the pair stalled twice there earlier this month. Beneath .6000, wedge support sits just under .5950, a level that has attracted multiple bounces through February. A break there would shift focus towards the 50 and 200DMAs.
Breakout leaves NZD/JPY hanging
Source: TradingView
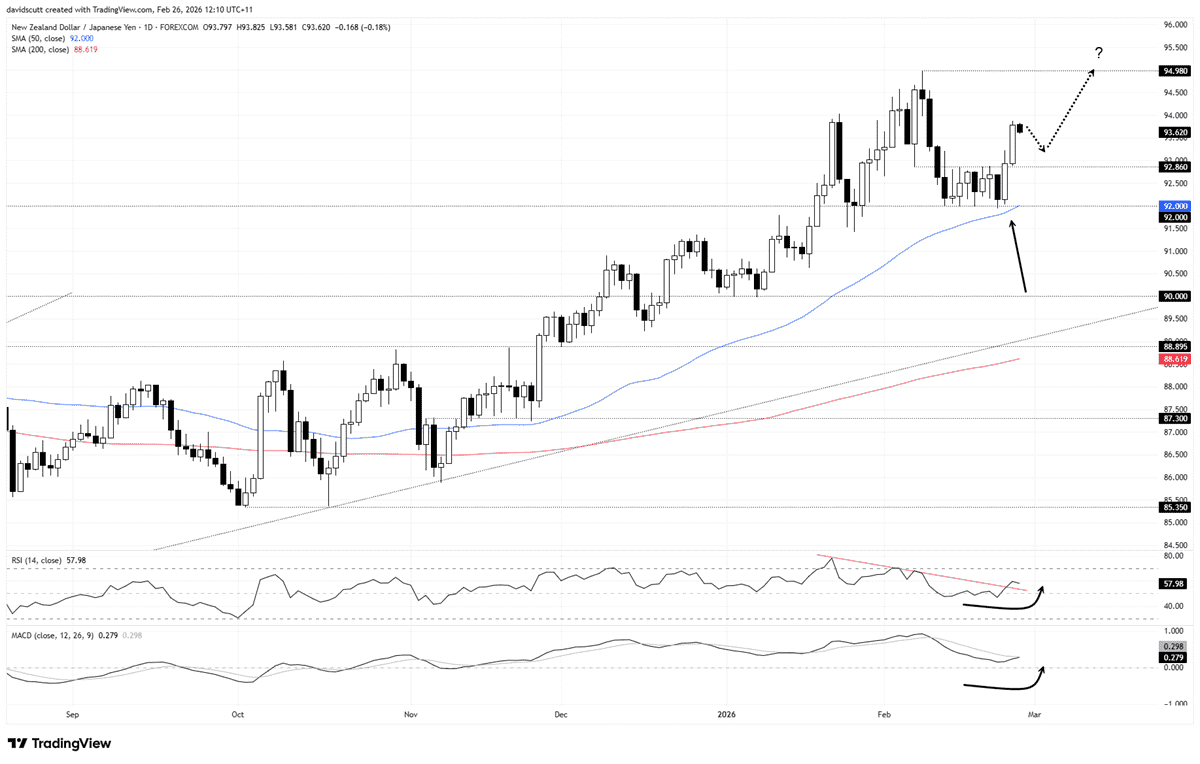
The backdrop is not dissimilar for NZD/JPY, although the price broke above resistance at 92.86 on Wednesday, increasing the probability of a retest of the highs set in early February. With the sequence of lower highs now broken in RSI (14), and with MACD on the cusp of delivering a bullish crossover of the signal line, directional risks also appear to be shifting higher.
However, price action looks slightly stretched following the breakout, providing fewer obvious levels to build near-term trades around. Aside from 92.86, the 93.20 region capped the pair twice in recent weeks, placing it on the radar. A retracement towards that zone may offer a cleaner entry level for longs, allowing stops to be placed beneath either 93.20 or 92.86 for protection, targeting the February highs of 94.98.
If the price were to slip back beneath 92.86, attention should turn to 92.00 where horizontal support intersects with the 50DMA. That level looms as key. A clean break beneath would invalidate the near-term bullish bias, bringing downside levels into focus including 91.45, 90.64, and 90.00.


Open an account in minutes
Experience award-winning platforms with fast and secure execution, and enjoy tight spreads from 0.5 pts on FX and 0.3 pts on indices.
Economic calendar
Web Trader platform
Our sophisticated web-based platform is packed with features.
Related articles
ASX 200 Outlook: A Rates Trade Disguised as a Stock Market?
Australian bond futures have exhibited a far stronger relationship with the ASX 200 than Wall Street over recent months. Now both markets are displaying remarkably similar price structures.

AUD/USD Bulls Fight Back After Australian Jobs Shock
AUD/USD has been hit by another ugly Australian employment report, sending RBA rate hike expectations sharply lower. Yet the relationships driving the currency have shifted since quarter-end, and improving risk appetite could provide the fuel for a recovery.

Bitcoin Bulls Eye Weekend Bounce as Nasdaq Finds Support
Bitcoin bulls eye a weekend bounce as Nasdaq finds support, BTC holds $80k and bullish reversal signals emerge alongside stronger correlations.

This report is intended for general circulation only. It should not be construed as a recommendation, or an offer (or solicitation of an offer) to buy or sell any financial products. The information provided does not take into account your specific investment objectives, financial situation or particular needs. Before you act on any recommendation that may be contained in this report, independent advice ought to be sought from a financial adviser regarding the suitability of the investment product, taking into account your specific investment objectives, financial situation or particular needs.
StoneX Financial Pte. Ltd., may distribute reports produced by its respective foreign entities or affiliates within the StoneX group of companies or third parties pursuant to an arrangement under Regulation 32C of the Financial Advisers Regulations. Where the report is distributed to a person in Singapore who is not an accredited investor, expert investor or an institutional investor (as defined in the Securities Futures Act), StoneX Financial Pte. Ltd. accepts legal responsibility to such persons for the contents of the report only to the extent required by law. Singapore recipients should contact StoneX Financial Pte. Ltd. at 6826 9988 for matters arising from, or in connection with the report.
In the case of all other recipients of this report, to the extent permitted by applicable laws and regulations neither StoneX Financial Pte. Ltd. nor its associated companies will be responsible or liable for any loss or damage incurred arising out of, or in connection with, any use of the information contained in this report and all such liability is hereby expressly disclaimed. No representation or warranty is made, express or implied, that the content of this report is complete or accurate.
StoneX Financial Pte. Ltd. is not under any obligation to update this report.
Trading CFDs carries a high level of risk that may not be suitable for some investors. Consider your investment objectives, level of experience, financial resources, risk appetite and other relevant circumstances carefully. The possibility exists that you could lose some or all of your investments, including your initial deposits. If in doubt, please seek independent expert advice. Visit www.forex.com/en-sg/terms-and-policies for the complete Risk Disclosure Statement.