


NZD/USD, NZD/JPY price action setups: Kiwi traders eye BOJ and Fed risk
NZD/USD continues to drift in a range, but NZD/JPY directional risks look skewed higher heading into the BOJ and Fed policy decisions.
Share this:

- NZD/USD stuck between .5920 and the 200-day moving average
- NZD/JPY presses 94.30 triangle resistance, risks skewed higher
- BOJ may struggle to sound hawkish enough, weighing on yen
- Fed focus falls on Powell’s future
Summary
NZD/USD remains stuck in a holding pattern after recovering from the early Iran war selloff, while NZD/JPY is eyeing a bullish breakout with directional risks skewed higher as the pair compresses beneath triangle resistance ahead of the BOJ and Fed decisions. With the BOJ at risk of underdelivering against hawkish pricing and Fed focus on Powell’s future, both events may generate volatility, with Strait of Hormuz headlines a constant swing factor for sentiment.
Kiwi traders ready for BOJ, Fed
For Kiwi traders, the two major event risks over the next two days are the same ones dominating the broader FX landscape: the BOJ and Fed decisions, alongside the ongoing threat of fresh headlines tied to the Strait of Hormuz.
The BOJ is widely expected to hold rates, meaning the bigger risk may be that it does not come across hawkish enough to justify current market pricing for further tightening later this year, assuming it does not spring a genuine surprise and hike outright. If that were the outcome, Japanese yields may ease and yen crosses could catch a bid, creating upside risks for NZD/JPY.
The Fed is also expected to stand pat, leaving attention on Jerome Powell and whether he signals if he intends to remain on the Board as a governor when his term as chair expires on May 15 or leave the Fed altogether. If it is the latter, it may marginally tilt near-term directional risks for the US dollar lower given it could bring forward changes to the future voting makeup of the FOMC.
With those risks looming, the contrast in current chart structures is notable: NZD/USD continues to chop sideways awaiting a catalyst, while NZD/JPY looks at risk of breaking higher should the BOJ underwhelm or broader risk sentiment remain supported.
NZD/USD waits for catalyst
Source: TradingView
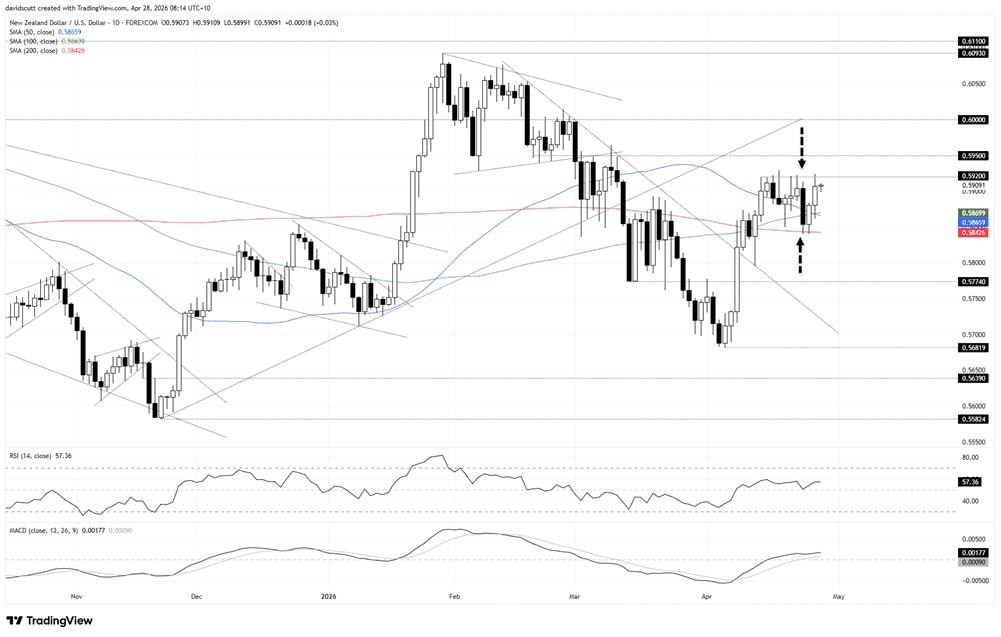
NZD/USD has settled into a range over the past fortnight, having recovered around half the losses seen in the early stages of the Iran war, attracting bids at the 200-day moving average on the downside and offers above .5920 resistance. That is the initial focal point for traders heading into a slew of major risk events that could influence the pair from both a rates and risk appetite perspective, including earnings results from several tech titans and the FOMC monetary policy decision on Wednesday.
While RSI (14) sits marginally above 50 and MACD has flipped into positive territory, having crossed above the signal line in early April, the overall message remains largely neutral when it comes to directional bias, even if momentum still sits marginally with the bulls.
Should we continue to see failures above .5920 resistance, shorts could be set with a tight stop above, targeting the 200-day moving average. And should the pair retrace back towards the 200-day moving average and bounce, it would also allow for longs to be set with a tight stop below, targeting .5920.
Either side of the prevailing sideways range, watch for offers at .5950 and .6000 on the topside should we eventually see a bullish breakout. A sustained break beneath the 200-day moving average would put .5774 in focus given it previously acted as support and resistance earlier this year. .5800, where the pair bounced strongly on April 13, is another level to watch in between.
NZD/JPY eyes upside break
Source: TradingView
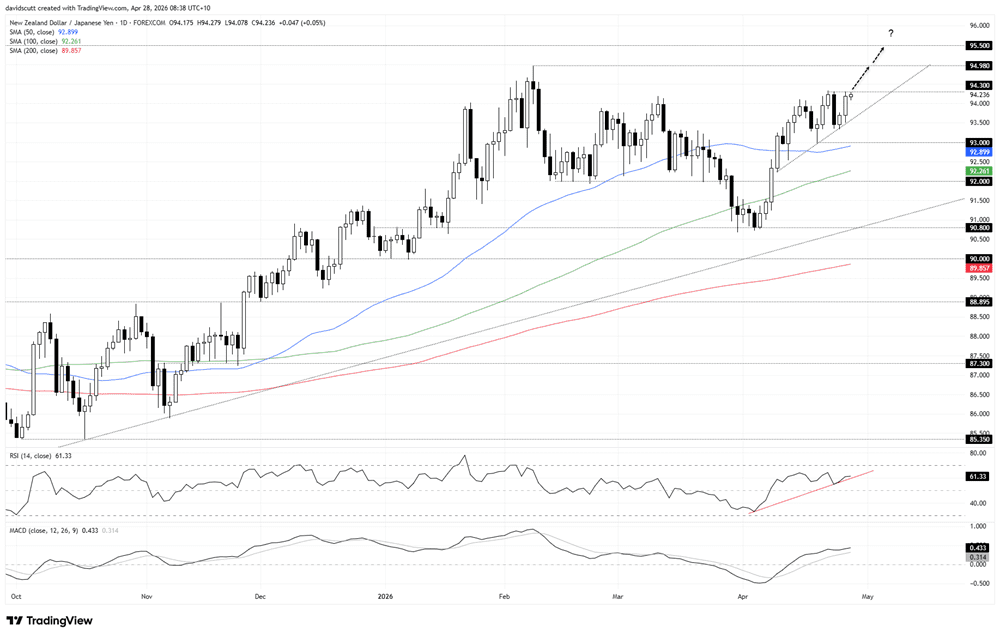
While NZD/USD is not providing any strong clues on where near-term directional risks may lie, it is a different story for NZD/JPY which continues to compress in an ascending triangle structure, pointing to the risk of an eventual bullish breakout and a retest of 94.98, the multi-year swing high set in February.
For now, the pair sits just beneath resistance at 94.30, making that the immediate overhead level to watch. A break and hold of 94.30, preferably with a back-test and bounce, would allow for longs to be set with a tight stop below for protection, targeting 94.98 initially and, beyond that, 95.50, a level that acted as support and resistance in mid-2024. Given where the triangle structure formed, achieving the latter target does not screen as a stretch, with a break above that level opening the door for a run towards 97.25 and the 2024 high of 99.02.
Of course, just because the pair finds itself coiling within a bullish structure does not mean a breakout will take place, meaning continued failures at 94.30 still allow for short setups to be considered. Shorts could be set beneath the level with a stop above, targeting either the April uptrend, confluence of the 50-day moving average with the low of 93.00 set on April 20, along with the 100-day moving average and 92.00 support.
The message from the oscillators is largely bullish when it comes to directional risks, with RSI (14) above 60 while MACD continues to trend higher in positive territory, having already crossed the signal line from below. There is some evidence of negative divergence between RSI and price, which raises a minor red flag, although it is not a definitive signal as yet.
Latest market news




Open an account in minutes
Experience award-winning platforms with fast and secure execution, and enjoy tight spreads from 0.5 pts on FX and 0.3 pts on indices.
Economic calendar
Web Trader platform
Our sophisticated web-based platform is packed with features.
Related articles
Silver's bullish breakout case builds as bond yields retreat
The Democratic blue wave has sent crude and Treasury yields sharply lower, improving the outlook for precious metals. With gold already breaking higher, could silver be next?
Gold Reclaims $4,000, Bulls Eye Reversal with Seasonality Tailwind
Gold futures rebound above $4,000 as falling US yields, improving sentiment and bullish seasonality raise hopes of a significant reversal.

GBP/USD, GBP/AUD: Sterling Rally Faces a BoE Reality Check
Sterling faces a reality check as the BoE prepares to hike rates. GBP/USD and GBP/AUD approach resistance, leaving bulls vulnerable to dovish guidance.
This report is intended for general circulation only. It should not be construed as a recommendation, or an offer (or solicitation of an offer) to buy or sell any financial products. The information provided does not take into account your specific investment objectives, financial situation or particular needs. Before you act on any recommendation that may be contained in this report, independent advice ought to be sought from a financial adviser regarding the suitability of the investment product, taking into account your specific investment objectives, financial situation or particular needs.
StoneX Financial Pte. Ltd., may distribute reports produced by its respective foreign entities or affiliates within the StoneX group of companies or third parties pursuant to an arrangement under Regulation 32C of the Financial Advisers Regulations. Where the report is distributed to a person in Singapore who is not an accredited investor, expert investor or an institutional investor (as defined in the Securities Futures Act), StoneX Financial Pte. Ltd. accepts legal responsibility to such persons for the contents of the report only to the extent required by law. Singapore recipients should contact StoneX Financial Pte. Ltd. at 6826 9988 for matters arising from, or in connection with the report.
In the case of all other recipients of this report, to the extent permitted by applicable laws and regulations neither StoneX Financial Pte. Ltd. nor its associated companies will be responsible or liable for any loss or damage incurred arising out of, or in connection with, any use of the information contained in this report and all such liability is hereby expressly disclaimed. No representation or warranty is made, express or implied, that the content of this report is complete or accurate.
StoneX Financial Pte. Ltd. is not under any obligation to update this report.
Trading CFDs carries a high level of risk that may not be suitable for some investors. Consider your investment objectives, level of experience, financial resources, risk appetite and other relevant circumstances carefully. The possibility exists that you could lose some or all of your investments, including your initial deposits. If in doubt, please seek independent expert advice. Visit www.forex.com/en-sg/terms-and-policies for the complete Risk Disclosure Statement.