



Rising yields showing signs of cracks in housing market; USD/JPY
Rising US yields are causing homebuyers to take pause and rethink their house purchase.
Share this:

The average 30-year mortgage rate for the week ending April 22nd rose to 5.37% from 5.2% the week prior. This was the highest level since 2009! In addition, mortgage rate applications for the same week fell by 8.3% vs a fall of 5% the week prior. This was the 7th week in a row that mortgage applications fell. These housing metrics are used as leading indicators for housing activity over the next few months.
Rising interest rates have already begun to hit the housing market as Pending Home Sales for March were down 1.2% vs down 4.1% in February. This was the 5th straight monthly decline. New Home Sales in March dropped 8.6% vs a drop of 1.2% previously. This was the 3rd consecutive monthly drop. Existing Home Sales fell by 2.7% in March vs -8.6% in February.
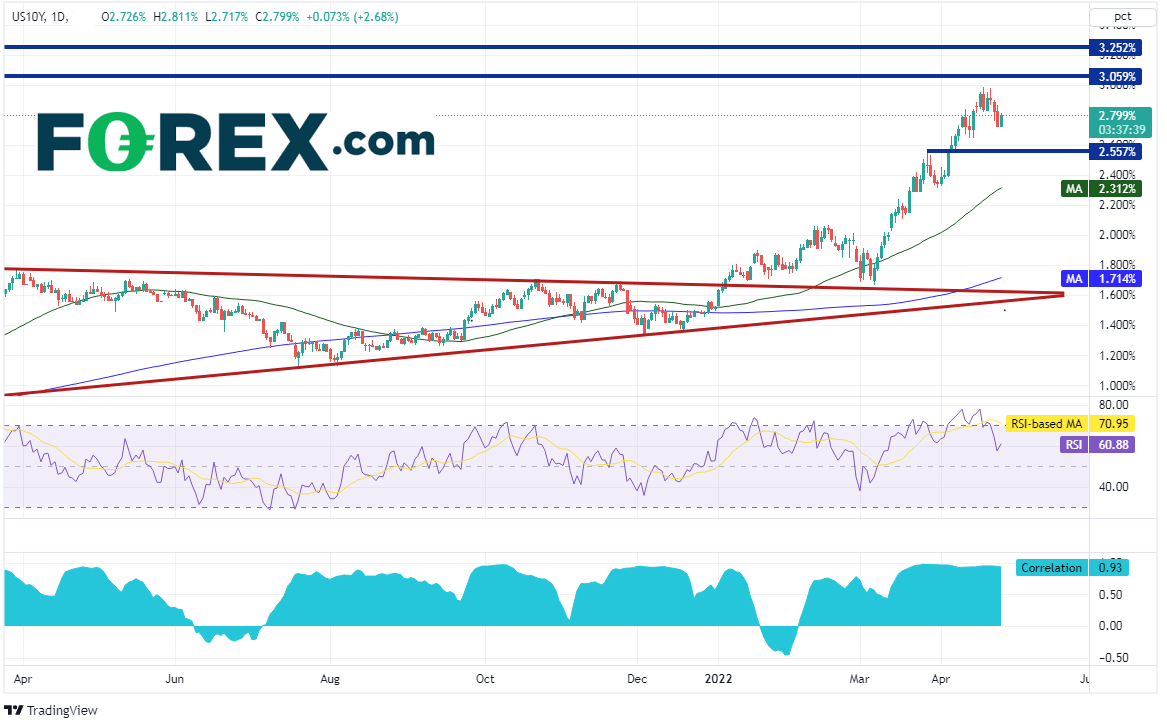
If long-term US interest rates continue to climb, then the housing market should continue to slow. This, along with inflation, reduces the purchasing power for people when buying large ticket items, such as a house. The current yield on the US 10-year Treasury is near 2.80%, just off its recent highs of 2.981% on April 20th. Notice that in just over 7 weeks, the key interest rate rose from 1.68% to 2.98%! The next resistance level is 3.059% and then the highs from November 2018 at 3.252%.

Source: Tradingview, Stone X
On a daily timeframe, there is support in 10-year yields at 2.557%, but then not until the 50 Day Moving Average at 2.312%. The bottom panel of the chart shows the correlation coefficient between 10-year yields and USD/JPY. The current reading is +0.93. Readings above +0.80 are considered to be strong correlations between 2 assets. Therefore, the correlation between USD/JPY and US 10-year yields is considered to be strong.
Source: Tradingview, Stone X
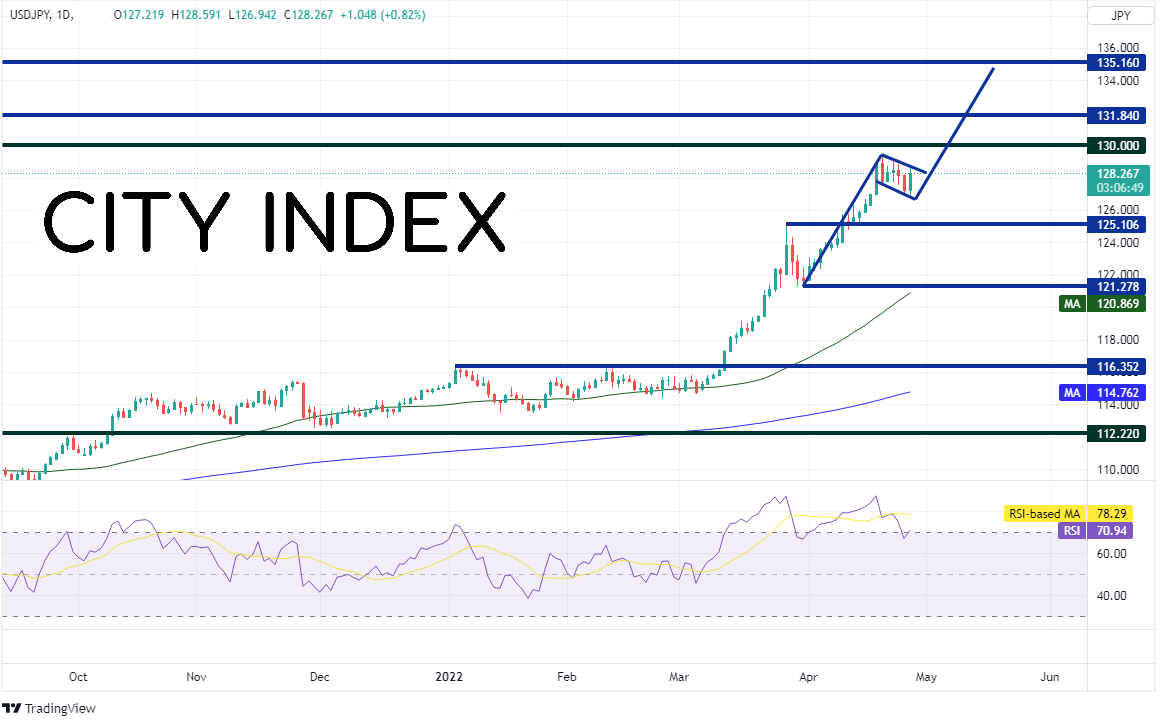
As one may have expected, USD/JPY has been racing higher with US 10-year yields. On a daily timeframe, price is currently consolidating in a flag pattern as the RSI pulls back into neutral territory. The price action for today’s candlestick is a bullish engulfing candle, in which today’s real body engulfs the real body of yesterday’s candlestick. This is considered to be bullish. If price does break higher, the target is near 134.75! However, price must first break through resistance at the psychological round number of 130, then horizontal resistance from 2002 at 131.84. If the flag pattern fails and USD/JPY moves lower, horizontal support sits at 125.10, then not again until 121.28.

Source: Tradingview, Stone X
Rising US yields are causing homebuyers to take pause and rethink their house purchase. In addition, due to the strong positive correlation between USD/JPY and 10-year yields, USD/JPY is moving higher. If yields move lower, watch to see if the housing market picks back up or if USD/JPY moves lower!
The average 30-year mortgage rate for the week ending April 22nd rose to 5.37% from 5.2% the week prior. This was the highest level since 2009! In addition, mortgage rate applications for the same week fell by 8.3% vs a fall of 5% the week prior. This was the 7th week in a row that mortgage applications fell. These housing metrics are used as leading indicators for housing activity over the next few months.
Rising interest rates have already begun to hit the housing market as Pending Home Sales for March were down 1.2% vs down 4.1% in February. This was the 5th straight monthly decline. New Home Sales in March dropped 8.6% vs a drop of 1.2% previously. This was the 3rd consecutive monthly drop. Existing Home Sales fell by 2.7% in March vs -8.6% in February.
If long-term US interest rates continue to climb, then the housing market should continue to slow. This, along with inflation, reduces the purchasing power for people when buying large ticket items, such as a house. The current yield on the US 10-year Treasury is near 2.80%, just off its recent highs of 2.981% on April 20th. Notice that in just over 7 weeks, the key interest rate rose from 1.68% to 2.98%! The next resistance level is 3.059% and then the highs from November 2018 at 3.252%.

Source: Tradingview, Stone X
On a daily timeframe, there is support in 10-year yields at 2.557%, but then not until the 50 Day Moving Average at 2.312%. The bottom panel of the chart shows the correlation coefficient between 10-year yields and USD/JPY. The current reading is +0.93. Readings above +0.80 are considered to be strong correlations between 2 assets. Therefore, the correlation between USD/JPY and US 10-year yields is considered to be strong.

Source: Tradingview, Stone X
As one may have expected, USD/JPY has been racing higher with US 10-year yields. On a daily timeframe, price is currently consolidating in a flag pattern as the RSI pulls back into neutral territory. The price action for today’s candlestick is a bullish engulfing candle, in which today’s real body engulfs the real body of yesterday’s candlestick. This is considered to be bullish. If price does break higher, the target is near 134.75! However, price must first break through resistance at the psychological round number of 130, then horizontal resistance from 2002 at 131.84. If the flag pattern fails and USD/JPY moves lower, horizontal support sits at 125.10, then not again until 121.28.
Source: Tradingview, Stone X
Trade USD/JPY now: Login or Open a new account!
• Open an account in the UK
• Open an account in Australia
• Open an account in Singapore
Rising US yields are causing homebuyers to take pause and rethink their house purchase. In addition, due to the strong positive correlation between USD/JPY and 10-year yields, USD/JPY is moving higher. If yields move lower, watch to see if the housing market picks back up or if USD/JPY moves lower!
Learn more about forex trading opportunities.
Related tags:
Latest market news



Open an account in minutes
Experience award-winning platforms with fast and secure execution, and enjoy tight spreads from 0.5 pts on FX and 0.3 pts on indices.
Economic calendar
Web Trader platform
Our sophisticated web-based platform is packed with features.
Related articles
US Dollar, GBP/USD, USD/CAD, USD/CHF, Gold Weekly Technical Outlook 11 2 2026
Sr. Technical Strategist Michael Boutros highlights the levels that matter on the USD Majors, commodities, and equity indices charts this week.

US Midterm Forecast: The Key Risks for Traders to Watch Through the US Elections
Prediction markets are pricing in nearly 75% odds of a Democratic sweep in this week’s US midterm elections, a development that would result in a split from the single party Republican rule of the past two years - what will it mean for markets?

Gold forecast: XAU/USD stabilised after recent falls – for now
Gold has started the first week of the new month trying to recover some ground after another bruising week. Oil prices have taken a sharp drop and that has allowed risk assets to bounce back, which has clearly helped the precious metal too. However, with sentiment remaining bearish towards the metals, and with $4000 level having been taken out last week, the path of least resistance is to the downside for gold.

This report is intended for general circulation only. It should not be construed as a recommendation, or an offer (or solicitation of an offer) to buy or sell any financial products. The information provided does not take into account your specific investment objectives, financial situation or particular needs. Before you act on any recommendation that may be contained in this report, independent advice ought to be sought from a financial adviser regarding the suitability of the investment product, taking into account your specific investment objectives, financial situation or particular needs.
StoneX Financial Pte. Ltd., may distribute reports produced by its respective foreign entities or affiliates within the StoneX group of companies or third parties pursuant to an arrangement under Regulation 32C of the Financial Advisers Regulations. Where the report is distributed to a person in Singapore who is not an accredited investor, expert investor or an institutional investor (as defined in the Securities Futures Act), StoneX Financial Pte. Ltd. accepts legal responsibility to such persons for the contents of the report only to the extent required by law. Singapore recipients should contact StoneX Financial Pte. Ltd. at 6826 9988 for matters arising from, or in connection with the report.
In the case of all other recipients of this report, to the extent permitted by applicable laws and regulations neither StoneX Financial Pte. Ltd. nor its associated companies will be responsible or liable for any loss or damage incurred arising out of, or in connection with, any use of the information contained in this report and all such liability is hereby expressly disclaimed. No representation or warranty is made, express or implied, that the content of this report is complete or accurate.
StoneX Financial Pte. Ltd. is not under any obligation to update this report.
Trading CFDs carries a high level of risk that may not be suitable for some investors. Consider your investment objectives, level of experience, financial resources, risk appetite and other relevant circumstances carefully. The possibility exists that you could lose some or all of your investments, including your initial deposits. If in doubt, please seek independent expert advice. Visit www.forex.com/en-sg/terms-and-policies for the complete Risk Disclosure Statement.