




S&P 500 analysis: US stocks drop after Fitch downgrade
Apart from the Fitch ratings downgrade, the focus will remain on the jobs market this week. The release of the ADP private payrolls report earlier didn’t lift the mood much, even if the data came in much better than expected at 324K vs. 191K eyed.
Share this:

The biggest catalyst behind the stock market sell-off today is that unexpected announcement from Fitch downgrading US credit rating. Overnight saw US index futures and global equity markets drop, before futures bounced back a tad. However, the selling then resumed again shortly after the cash markets opened.
In case you missed it, Fitch downgraded the US from AAA to AA+, with a stable outlook. The ratings agency cited the fiscal deterioration over “the next three” years and high levels of government debt as the main reasons for the downgrade.
What happened the last time US credit rating was downgraded?
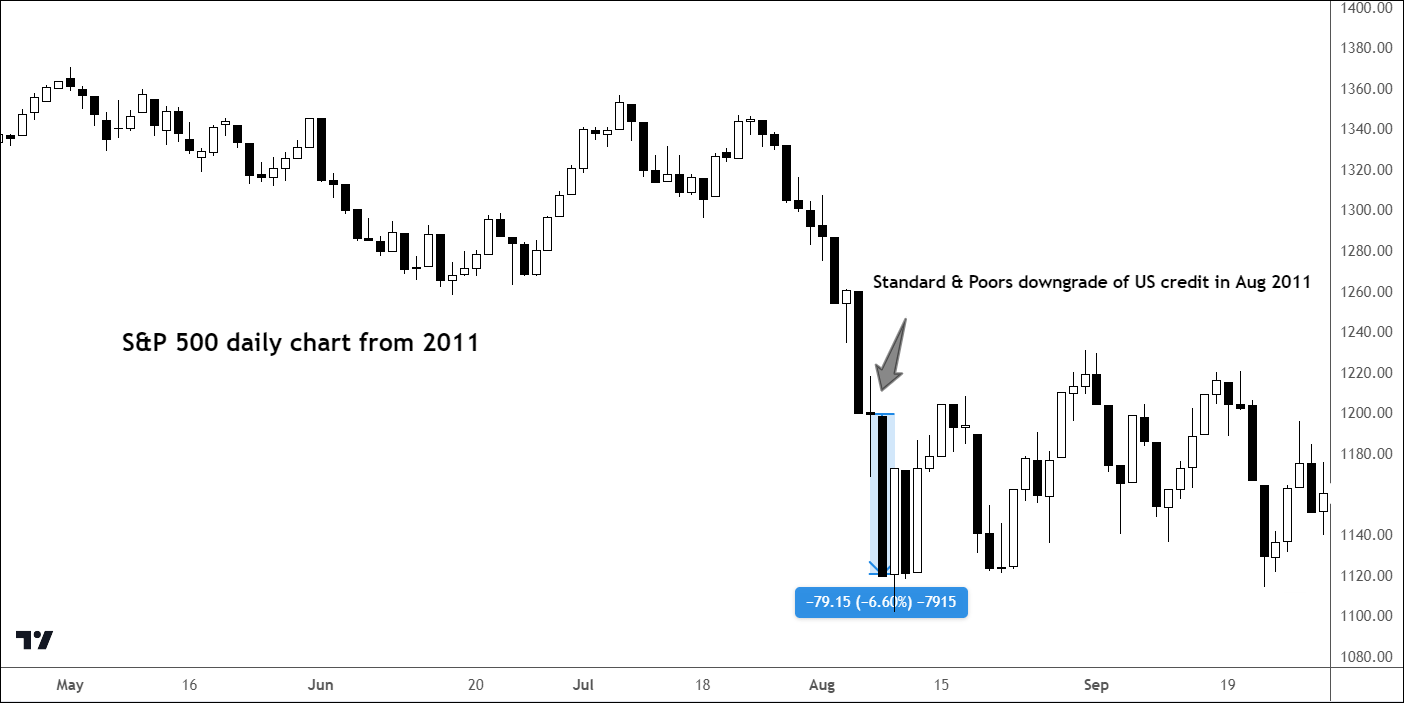
The last time that the US credit rating was downgraded was about 12 years ago at the hand of the S&P ratings agency, who reduced the US to AA+ from triple A, on August 5, 2011. That cut had happened late in the afternoon on a Friday, so when the markets opened the next Monday, the reaction was a swift one – the S&P 500 index fell about 80 points or 6 and a half percent:
Will history repeat itself?
The sell-off in response to the 2011 ratings downgrade had come on the back of an already-weak market, with the index being in a downtrend.
This time, the market is in a clear uptrend, which partly explains why we haven’t had a major sell-off yet. But this means that there’s the potential for a sharper sell-off as investors digest the news with the cash markets having just opened.
It is not all about the debt downgrade
Apart from the Fitch ratings downgrade, the focus will remain on the jobs market this week. The release of the ADP private payrolls report earlier didn’t lift the mood much, even if the data came in much better than expected at 324K vs. 191K eyed.
Jobless claims and the employment component of the ISM services PMI will be released on Thursday, and then – the big one – the official nonfarm payrolls report on Friday. In terms of company earnings, results from tech giants Apple and Amazon will be the big ones to watch on Thursday, which could move the S&P 500 sharply.
The Fed has made it quite clear that US monetary policy is now restrict enough and that the next policy decision in September would be entirely data dependent. Until then, we will have two more inflation and a couple of jobs reports to consider. While the focus is clearly on inflation as employment is still very strong, any potential weakness in jobs data could cement expectations of a policy hold. But another surprisingly strong employment report on Friday would keep the threat of further Fed hikes alive. This may explain why stocks have fallen today despite the strong ADP report.
S&P 500 analysis: Bullish exhaustion ahead of big events
The S&P 500 reached a 16-month high last week, before losing some momentum on Thursday. And while the bulls quickly bought that dip, Thursday’s high has not been broken, which is giving the bears a clear invalidation level to work with.
Therefore, watch last week’s low at 4527 (i.e., Thursday’s bearish engulfing candle low) closely as a decisive move below it could trigger some follow-up technical selling. But if we see a quick break and a bounce back inside last week’s range, then that would be a potentially bullish signal.
All told, the risks are skewed to the downside in the short-term outlook. With some investors likely to sit on their hands ahead of Friday’s US employment data and earnings from giants Apple and Amazon on Thursday, we may see the correction get a bit larger in light of the Fitch downgrade.
Meanwhile, the Relative Strength Index (RSI) has been diverging with price action at ‘overbought’ levels, pointing to possible bullish exhaustion.
-- Written by Fawad Razaqzada, Market Analyst
Follow Fawad on Twitter @Trader_F_R
Source for charts used in this article: TradingView.com
How to trade with City Index
You can trade with City Index by following these four easy steps:
- Open an account, or log in if you’re already a customer
• Open an account in the UK
• Open an account in Australia
• Open an account in Singapore
- Search for the company you want to trade in our award-winning platform
- Choose your position and size, and your stop and limit levels
- Place the trade
Related tags:


Open an account in minutes
Experience award-winning platforms with fast and secure execution, and enjoy tight spreads from 0.5 pts on FX and 0.3 pts on indices.
Economic calendar
Web Trader platform
Our sophisticated web-based platform is packed with features.
Related articles

US Dollar Technical Outlook: DXY Bulls Meet Resistance at Yearly Highs 10 1 2026
The U.S. Dollar has held firm despite fading Fed hike bets, but Friday’s payrolls could test the rally’s staying power.


Dow Jones forecast: Stock markets under pressure from multiple sources
When looking at the major tech-heavy US indices like the S&P 500 or the Nasdaq 100, you wouldn’t think that the stock market is particularly weak. Yet, beneath the surface, the market is far from healthy right now. Investors are evidently just piling into the big tech and AI names, and as a result, market breadth is deteriorating. Other indices like the small cap Russell 2000 and the Dow Jones are starting to reflect that weakness.

Nikkei breakout accelerates as yen weakness returns
Nikkei has started October with a powerful breakout, helped by renewed yen weakness and strong upside momentum

This report is intended for general circulation only. It should not be construed as a recommendation, or an offer (or solicitation of an offer) to buy or sell any financial products. The information provided does not take into account your specific investment objectives, financial situation or particular needs. Before you act on any recommendation that may be contained in this report, independent advice ought to be sought from a financial adviser regarding the suitability of the investment product, taking into account your specific investment objectives, financial situation or particular needs.
StoneX Financial Pte. Ltd., may distribute reports produced by its respective foreign entities or affiliates within the StoneX group of companies or third parties pursuant to an arrangement under Regulation 32C of the Financial Advisers Regulations. Where the report is distributed to a person in Singapore who is not an accredited investor, expert investor or an institutional investor (as defined in the Securities Futures Act), StoneX Financial Pte. Ltd. accepts legal responsibility to such persons for the contents of the report only to the extent required by law. Singapore recipients should contact StoneX Financial Pte. Ltd. at 6826 9988 for matters arising from, or in connection with the report.
In the case of all other recipients of this report, to the extent permitted by applicable laws and regulations neither StoneX Financial Pte. Ltd. nor its associated companies will be responsible or liable for any loss or damage incurred arising out of, or in connection with, any use of the information contained in this report and all such liability is hereby expressly disclaimed. No representation or warranty is made, express or implied, that the content of this report is complete or accurate.
StoneX Financial Pte. Ltd. is not under any obligation to update this report.
Trading CFDs carries a high level of risk that may not be suitable for some investors. Consider your investment objectives, level of experience, financial resources, risk appetite and other relevant circumstances carefully. The possibility exists that you could lose some or all of your investments, including your initial deposits. If in doubt, please seek independent expert advice. Visit www.forex.com/en-sg/terms-and-policies for the complete Risk Disclosure Statement.