



SP500 - a dead cat bounce or a stronger recovery Part II?
This morning, the Federal Reserve followed the lead of the ECB last week to deliver a hawkish surprise. The Feds dot plots showed the median dot in 2022 rose to 1.875%, consistent with another six rate hikes in 2022, in line with market expectations.
Share this:

However, the median dot in 2023 at 2.75% indicates an intention to take the terminal rate firmly above the neutral rate. An imminent start to quantitative tightening was also flagged. Despite this, equity markets ripped higher, contrary to what might have been expected. 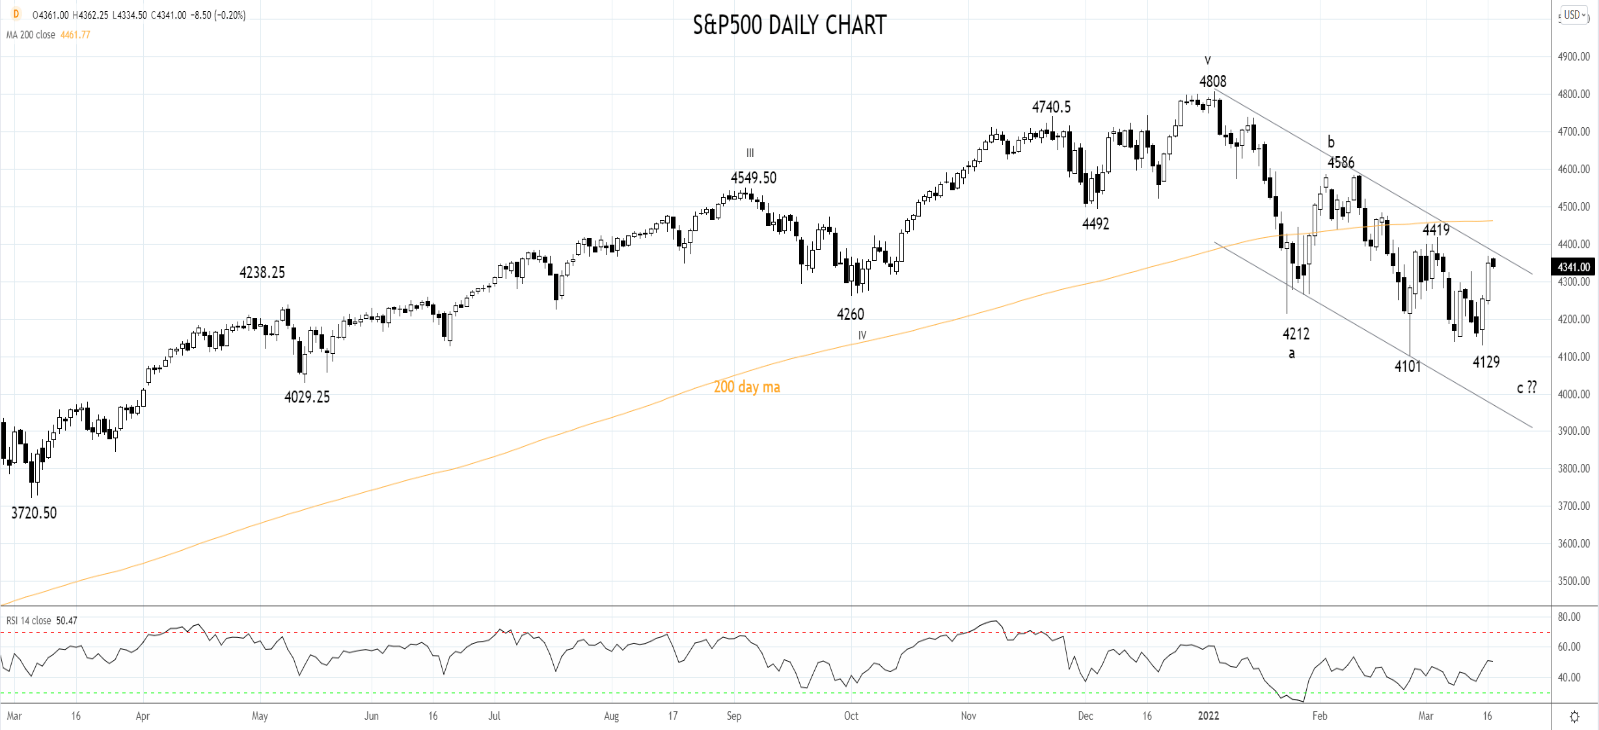
There have been conflicting narratives surrounding the status of the peace talks between Russia and Ukraine. However, an acknowledgement by Ukraine's President Zelensky that peace talks were becoming "more realistic" after three bitter weeks of the war was a positive development.
Earlier in the session and after a wild ride of late on Chinese equity markets, China's State Council announced steps to restore confidence in the economy and capital markets. A new Covid treatment strategy was also revealed to balance Covid containment with economic activity.
U.S equity markets also found encouragement from Fed Chair Powell, admitting "it may take longer than we like" to bring inflation down. Recognition that a slower, longer hiking cycle is required to support a "sustained economic expansion.”
A week ago, we asked here if the recovery from the 4100 low in the S&P500 was a dead cat bounce or the start of a more substantial recovery. As the chart below shows, the S&P500 is now eyeing the band of significant resistance noted in last week’s article at 4400/20.
Should the S&P500 close above 4380/20, we would be more open to the idea that a tradable low of sorts is in place at 4100. However, to ensure that the S&P500 is on a firmer footing, a sustained break above the 200-day moving at 4461 is needed. Until then, we remain cautious and comfortable with the idea, it's better to be too late than too early.
Source Tradingview. The figures stated areas of March 17th, 2022. Past performance is not a reliable indicator of future performance. This report does not contain and is not to be taken as containing any financial product advice or financial product recommendation
How to trade with City Index
You can trade with City Index by following these four easy steps:
- Open an account, or log in if you’re already a customer
• Open an account in the UK
• Open an account in Australia
• Open an account in Singapore
- Search for the company you want to trade in our award-winning platform
- Choose your position and size, and your stop and limit levels
- Place the trade
However, the median dot in 2023 at 2.75% indicates an intention to take the terminal rate firmly above the neutral rate. An imminent start to quantitative tightening was also flagged. Despite this, equity markets ripped higher, contrary to what might have been expected.
There have been conflicting narratives surrounding the status of the peace talks between Russia and Ukraine. However, an acknowledgement by Ukraine's President Zelensky that peace talks were becoming "more realistic" after three bitter weeks of the war was a positive development.
Earlier in the session and after a wild ride of late on Chinese equity markets, China's State Council announced steps to restore confidence in the economy and capital markets. A new Covid treatment strategy was also revealed to balance Covid containment with economic activity.
U.S equity markets also found encouragement from Fed Chair Powell, admitting "it may take longer than we like" to bring inflation down. Recognition that a slower, longer hiking cycle is required to support a "sustained economic expansion.”
A week ago, we asked here if the recovery from the 4100 low in the S&P500 was a dead cat bounce or the start of a more substantial recovery. As the chart below shows, the S&P500 is now eyeing the band of significant resistance noted in last week’s article at 4400/20.
Should the S&P500 close above 4380/20, we would be more open to the idea that a tradable low of sorts is in place at 4100. However, to ensure that the S&P500 is on a firmer footing, a sustained break above the 200-day moving at 4461 is needed. Until then, we remain cautious and comfortable with the idea, it's better to be too late than too early.
Source Tradingview. The figures stated areas of March 17th, 2022. Past performance is not a reliable indicator of future performance. This report does not contain and is not to be taken as containing any financial product advice or financial product recommendation
- Open a Forex.com account, or log in if you’re already a customer.
- Search for the pair you want to trade in our award-winning platform.
- Choose your position and size, and your stop and limit levels.
- Place the trade.
Latest market news




Open an account in minutes
Experience award-winning platforms with fast and secure execution, and enjoy tight spreads from 0.5 pts on FX and 0.3 pts on indices.
Economic calendar
Web Trader platform
Our sophisticated web-based platform is packed with features.
Related articles
S&P 500 Analysis: Earnings Uncertainty Continues to Weigh on the SPX
The trading week is coming to an end, and a phase of weakness remains evident across the S&P 500 in the short term. Recent price action reflects this dynamic, with SPX losing more than 2.00% over the last two trading sessions, bringing selling pressure back into focus.


Gold Outlook: Fed credibility takes a hit, but buyers aren't biting
The Fed's inflation-fighting credibility takes another knock, real yields are falling and the dollar is softening. Gold should be flying, yet buyers remain reluctant. What's going on?

FOMC Recap: Fed Holds, but Warsh Falls Short of a Full Hawkish Hold
FOMC Chairman Warsh fell short of delivering a clear hint that the Fed would raise rates again in December, resulting in a modestly less-hawkish-than-anticipated short-term interpretation of the event - what does that mean for the US dollar?

This report is intended for general circulation only. It should not be construed as a recommendation, or an offer (or solicitation of an offer) to buy or sell any financial products. The information provided does not take into account your specific investment objectives, financial situation or particular needs. Before you act on any recommendation that may be contained in this report, independent advice ought to be sought from a financial adviser regarding the suitability of the investment product, taking into account your specific investment objectives, financial situation or particular needs.
StoneX Financial Pte. Ltd., may distribute reports produced by its respective foreign entities or affiliates within the StoneX group of companies or third parties pursuant to an arrangement under Regulation 32C of the Financial Advisers Regulations. Where the report is distributed to a person in Singapore who is not an accredited investor, expert investor or an institutional investor (as defined in the Securities Futures Act), StoneX Financial Pte. Ltd. accepts legal responsibility to such persons for the contents of the report only to the extent required by law. Singapore recipients should contact StoneX Financial Pte. Ltd. at 6826 9988 for matters arising from, or in connection with the report.
In the case of all other recipients of this report, to the extent permitted by applicable laws and regulations neither StoneX Financial Pte. Ltd. nor its associated companies will be responsible or liable for any loss or damage incurred arising out of, or in connection with, any use of the information contained in this report and all such liability is hereby expressly disclaimed. No representation or warranty is made, express or implied, that the content of this report is complete or accurate.
StoneX Financial Pte. Ltd. is not under any obligation to update this report.
Trading CFDs carries a high level of risk that may not be suitable for some investors. Consider your investment objectives, level of experience, financial resources, risk appetite and other relevant circumstances carefully. The possibility exists that you could lose some or all of your investments, including your initial deposits. If in doubt, please seek independent expert advice. Visit www.forex.com/en-sg/terms-and-policies for the complete Risk Disclosure Statement.