




S&P 500 Outlook: ES Goes to Work on 5900
Stocks haven’t shown much for pullbacks of late, but S&P 500 Futures have struggled so far to gain acceptance through the 5900 level.
Share this:

S&P 500 Talking Points:
- Stocks continue to grind-higher, very similar to gold albeit with even less pullback along the way.
- As I wrote in the Q4 Forecast, given the Fed’s accommodative stance even despite higher-than-expected inflation, the wealth effect is still a driving factor in US economic policy, and thus it makes little sense to be anything more than ‘tactically bearish’ until that changes. But that also doesn’t mean that chasing and hoping are great strategy drivers.
- To download the full forecast, the link below will set that up.
It’s been a dramatic start to Q4 for both currencies and gold. But in US equities, it’s been relatively calm as the grind-higher has continued with a minimum of drama. The quarter opened with a pullback to support, which held for a week, and then bulls drove to another fresh ATH. There was some two-way interplay a week ago, when Monday saw a 1.03% breakout in S&P 500 Futures that pared back a day later with a 0.90% pullback. The remainder of the week saw buyers continue to press forward and as of this writing, the 5900 level remains in-play as buyers haven’t been able to leave it decisively behind.
S&P 500 Futures – Daily Price Chart
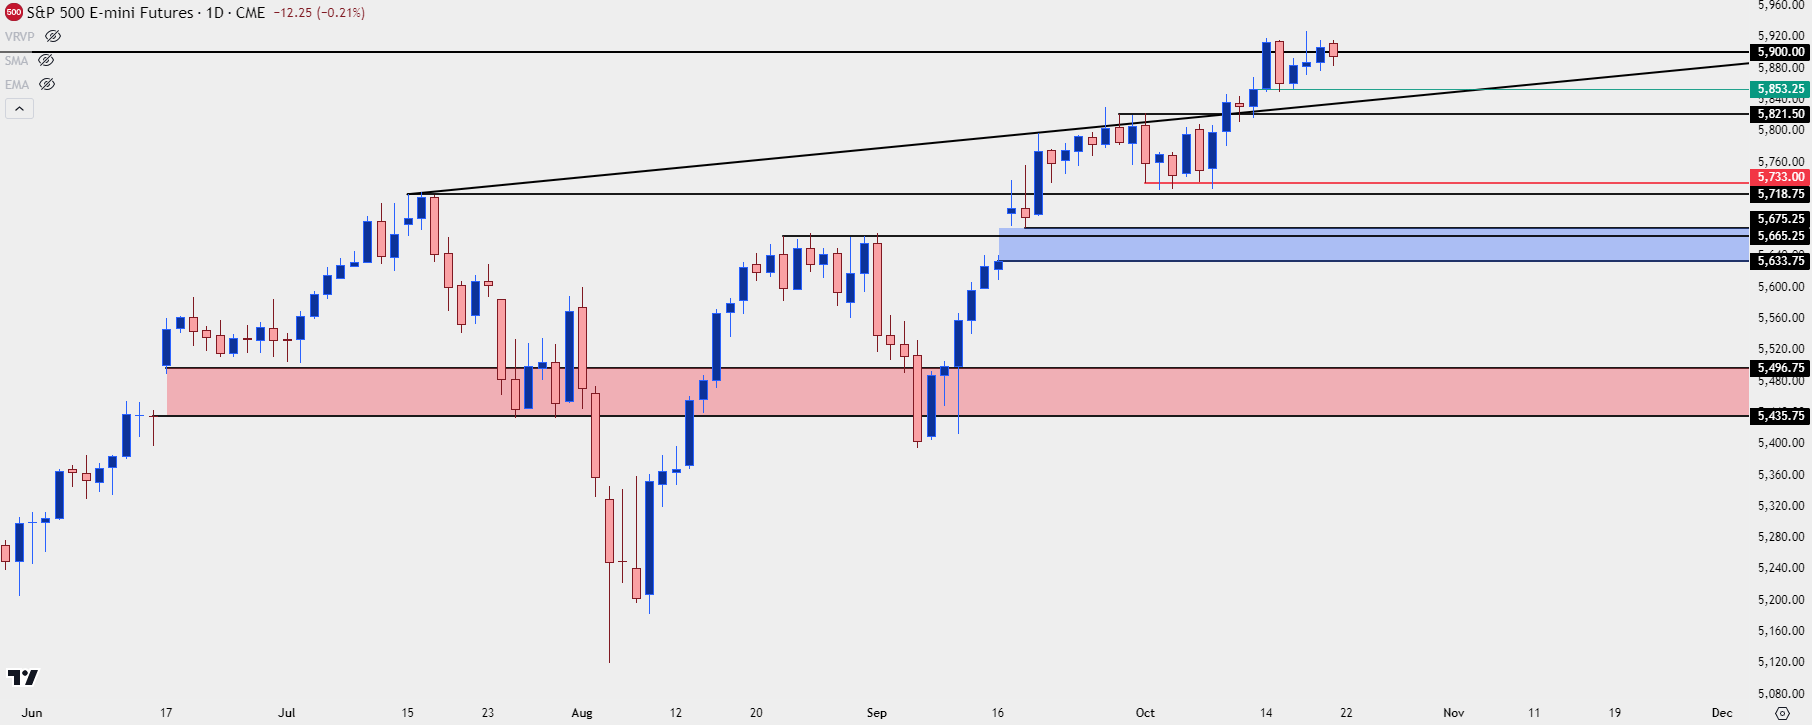 Chart prepared by James Stanley; data derived from Tradingview
Pullbacks Going Forward
As I’ve said in the past few quarterly forecasts, the long side of stocks can be difficult to chase given how grindy the moves-higher have been. This leaves little two-way price action with which to manage risk and place stops. But – the aftermath of pullbacks can produce some amenable environments for trend continuation.
In Q2 that pullback showed up at the quarterly open; in Q3 it was near the middle of the quarter. But in both cases there was a noticeable dent in the trend that soon showed a higher-low on the daily charts.
So, at this point, the option set isn’t great: Traders can either try to fade a really strong trend, or they can look to chase the move-higher, with the more attractive alternative trying to be patient and wait for another of those pullback scenarios. In that case, something like 5650 or 5500 could be realistic. But again, there’s no evidence of that yet as buyers have simply continued to push.
For those that are looking to push bullish momentum without a more noticeable pullback, shorter term charts can be used to try to find supports that can be used for risk management.
On the below four-hour chart, there’s an aggressive zone taken from resistance-turned-support that held last week’s swing-lows. That plots from 5846.50-5856. Below that, another zone just above the 5800 psychological level, spanning from 5808-5821.50.
If neither of those hold, then pullbacks would face a big test at the same support that held for a week after the Q4 open, running from 5818.75-5733.
For resistance overhead, the 5900 level appears to be what’s paused the move over the past week and there’s even been a build of lower-highs around that, highlighting that lacking acceptance above the big figure. I think a major reason this is happening is proximity to the major psychological level of 6k, which I’m considering to be a major pause-point to the trend if/when it happens during Q4.
If we do see buyers run a breakout without pulling back to support, then 5900 becomes a spot of higher-low support potential.
S&P 500 Futures Four-Hour Price Chart
 Chart prepared by James Stanley; data derived from Tradingview
--- written by James Stanley, Senior Strategist
S&P 500 Talking Points:
- Stocks continue to grind-higher, very similar to gold albeit with even less pullback along the way.
- As I wrote in the Q4 Forecast, given the Fed’s accommodative stance even despite higher-than-expected inflation, the wealth effect is still a driving factor in US economic policy, and thus it makes little sense to be anything more than ‘tactically bearish’ until that changes. But that also doesn’t mean that chasing and hoping are great strategy drivers.
- To download the full forecast, the link below will set that up.
It’s been a dramatic start to Q4 for both currencies and gold. But in US equities, it’s been relatively calm as the grind-higher has continued with a minimum of drama. The quarter opened with a pullback to support, which held for a week, and then bulls drove to another fresh ATH. There was some two-way interplay a week ago, when Monday saw a 1.03% breakout in S&P 500 Futures that pared back a day later with a 0.90% pullback. The remainder of the week saw buyers continue to press forward and as of this writing, the 5900 level remains in-play as buyers haven’t been able to leave it decisively behind.
S&P 500 Futures – Daily Price Chart
Chart prepared by James Stanley; data derived from Tradingview
Pullbacks Going Forward
As I’ve said in the past few quarterly forecasts, the long side of stocks can be difficult to chase given how grindy the moves-higher have been. This leaves little two-way price action with which to manage risk and place stops. But – the aftermath of pullbacks can produce some amenable environments for trend continuation.
In Q2 that pullback showed up at the quarterly open; in Q3 it was near the middle of the quarter. But in both cases there was a noticeable dent in the trend that soon showed a higher-low on the daily charts.
So, at this point, the option set isn’t great: Traders can either try to fade a really strong trend, or they can look to chase the move-higher, with the more attractive alternative trying to be patient and wait for another of those pullback scenarios. In that case, something like 5650 or 5500 could be realistic. But again, there’s no evidence of that yet as buyers have simply continued to push.
For those that are looking to push bullish momentum without a more noticeable pullback, shorter term charts can be used to try to find supports that can be used for risk management.
On the below four-hour chart, there’s an aggressive zone taken from resistance-turned-support that held last week’s swing-lows. That plots from 5846.50-5856. Below that, another zone just above the 5800 psychological level, spanning from 5808-5821.50.
If neither of those hold, then pullbacks would face a big test at the same support that held for a week after the Q4 open, running from 5818.75-5733.
For resistance overhead, the 5900 level appears to be what’s paused the move over the past week and there’s even been a build of lower-highs around that, highlighting that lacking acceptance above the big figure. I think a major reason this is happening is proximity to the major psychological level of 6k, which I’m considering to be a major pause-point to the trend if/when it happens during Q4.
If we do see buyers run a breakout without pulling back to support, then 5900 becomes a spot of higher-low support potential.
S&P 500 Futures Four-Hour Price Chart
Chart prepared by James Stanley; data derived from Tradingview
--- written by James Stanley, Senior Strategist
Related tags:
Latest market news




Open an account in minutes
Experience award-winning platforms with fast and secure execution, and enjoy tight spreads from 0.5 pts on FX and 0.3 pts on indices.
Economic calendar
Web Trader platform
Our sophisticated web-based platform is packed with features.
Related articles
Australian Dollar Outlook: AUD/USD Screams Sentiment Extreme Into Fed, CPI
AUD/USD rebounds despite record bearish futures positioning, with Australian Q3 CPI and the Fed meeting threatening to trigger another short squeeze.

EUR/USD weekly outlook: FOMC and ECB to set the tone
The current backdrop is modestly bearish. On Friday, the EUR/USD closed modestly lower, down for the third consecutive day. The pair also posted a weekly decline after staging a modest recovery attempt in the previous week. Out of the past 8 weeks, the EUR/USD has fallen on 6 occasions. There is not much supporting factors for the single currency right now. So, the upside remains capped.

S&P 500, Nasdaq, Dow Forecast: Nasdaq Selloff Deepens as Dow Rally Stalls 10 24 2026
A failed S&P breakout and looming Nasdaq support test raise the stakes for next week’s Fed decision and October’s monthly close.

This report is intended for general circulation only. It should not be construed as a recommendation, or an offer (or solicitation of an offer) to buy or sell any financial products. The information provided does not take into account your specific investment objectives, financial situation or particular needs. Before you act on any recommendation that may be contained in this report, independent advice ought to be sought from a financial adviser regarding the suitability of the investment product, taking into account your specific investment objectives, financial situation or particular needs.
StoneX Financial Pte. Ltd., may distribute reports produced by its respective foreign entities or affiliates within the StoneX group of companies or third parties pursuant to an arrangement under Regulation 32C of the Financial Advisers Regulations. Where the report is distributed to a person in Singapore who is not an accredited investor, expert investor or an institutional investor (as defined in the Securities Futures Act), StoneX Financial Pte. Ltd. accepts legal responsibility to such persons for the contents of the report only to the extent required by law. Singapore recipients should contact StoneX Financial Pte. Ltd. at 6826 9988 for matters arising from, or in connection with the report.
In the case of all other recipients of this report, to the extent permitted by applicable laws and regulations neither StoneX Financial Pte. Ltd. nor its associated companies will be responsible or liable for any loss or damage incurred arising out of, or in connection with, any use of the information contained in this report and all such liability is hereby expressly disclaimed. No representation or warranty is made, express or implied, that the content of this report is complete or accurate.
StoneX Financial Pte. Ltd. is not under any obligation to update this report.
Trading CFDs carries a high level of risk that may not be suitable for some investors. Consider your investment objectives, level of experience, financial resources, risk appetite and other relevant circumstances carefully. The possibility exists that you could lose some or all of your investments, including your initial deposits. If in doubt, please seek independent expert advice. Visit www.forex.com/en-sg/terms-and-policies for the complete Risk Disclosure Statement.