



Target Q1 Preview: Where next for Target stock?
Things are set to become tougher in 2022 as the acceleration in sales unwinds and the company battles against rising costs across the board.
Share this:

When will Target release Q1 2022 earnings?
Target is scheduled to release Q2 earnings before the markets open on Wednesday, May 18th, 2022.
Target Q1 earnings preview
Target’s earnings blew past expectations in the last quarter and capped off another solid year that saw the pandemic continue to boost its sales and earnings. However, things are set to become tougher in 2022 as the acceleration in sales unwinds and the company battles against rising costs across the board.
Wall Street expects Target will see comparable sales rise just 1.2% in the first quarter of 2022, which is markedly slower than the 12.7% average quarterly growth delivered the year before. Overall revenue is forecast to rise 2.2% year-on-year to $24.4 billion.
Adjusted EPS is expected to fall 16.2% from last year to $3.09 as it comes up against tough comparatives from the year before, when earnings rose six-fold.
Still, Target believes it can keep up the momentum this year and has said it is aiming to deliver mid-single digit growth in revenue and high-single digit growth in adjusted EPS in 2022. Wall Street currently believes Target can meet its goals and grow sales by 3.8% and adjusted EPS by 9.1% this year.
That guidance will be closely watched in case Target adjusts its view given the current environment, although Target should prove resilient given its scale and ability to keep prices low for cost-conscious shoppers.’
Where next for Target stock?
Targets stock price has been trading in a wide range over the last year between 184.00 and 268.98. On February 28th, price gapped higher 199.77 to 226.83, and has still yet to fill the gap. TGT reached a near term high on April 21st and has sold off aggressively since then. First support is at the 61.8% Fibonacci retracement level from the lows of February 28th to the highs of April 21st, near 210.90. If price continues to move lower, horizonal support is at 205.22, then the gap fill from February 28th at 199.77. However, if price reverses and moves higher, first horizontal resistance is at 223.20, just ahead of the 50 Day Moving Average at 224.73. If price breaks above there, the next resistance isn’t until the 200 Day Moving Average at 234.04.

Source: Tradingview, Stone X
You can trade Target shares with Forex.com in just four steps:
1. Open a Forex.com account, or log-in if you’re already a customer.
2. Search for ‘Target’ in our award-winning platform
3. Choose your position and size, and your stop and limit levels
4. Place the trade
Or you can try out your trading strategy risk-free by signing up for our Demo Account.
When will Target release Q1 2022 earnings?
Target is scheduled to release Q2 earnings before the markets open on Wednesday, May 18th, 2022.
Target Q1 earnings preview
Target’s earnings blew past expectations in the last quarter and capped off another solid year that saw the pandemic continue to boost its sales and earnings. However, things are set to become tougher in 2022 as the acceleration in sales unwinds and the company battles against rising costs across the board.
Wall Street expects Target will see comparable sales rise just 1.2% in the first quarter of 2022, which is markedly slower than the 12.7% average quarterly growth delivered the year before. Overall revenue is forecast to rise 2.2% year-on-year to $24.4 billion.
Adjusted EPS is expected to fall 16.2% from last year to $3.09 as it comes up against tough comparatives from the year before, when earnings rose six-fold.
Still, Target believes it can keep up the momentum this year and has said it is aiming to deliver mid-single digit growth in revenue and high-single digit growth in adjusted EPS in 2022. Wall Street currently believes Target can meet its goals and grow sales by 3.8% and adjusted EPS by 9.1% this year.
That guidance will be closely watched in case Target adjusts its view given the current environment, although Target should prove resilient given its scale and ability to keep prices low for cost-conscious shoppers.’
Where next for Target stock?
Targets stock price has been trading in a wide range over the last year between 184.00 and 268.98. On February 28th, price gapped higher 199.77 to 226.83, and has still yet to fill the gap. TGT reached a near term high on April 21st and has sold off aggressively since then. First support is at the 61.8% Fibonacci retracement level from the lows of February 28th to the highs of April 21st, near 210.90. If price continues to move lower, horizonal support is at 205.22, then the gap fill from February 28th at 199.77. However, if price reverses and moves higher, first horizontal resistance is at 223.20, just ahead of the 50 Day Moving Average at 224.73. If price breaks above there, the next resistance isn’t until the 200 Day Moving Average at 234.04.
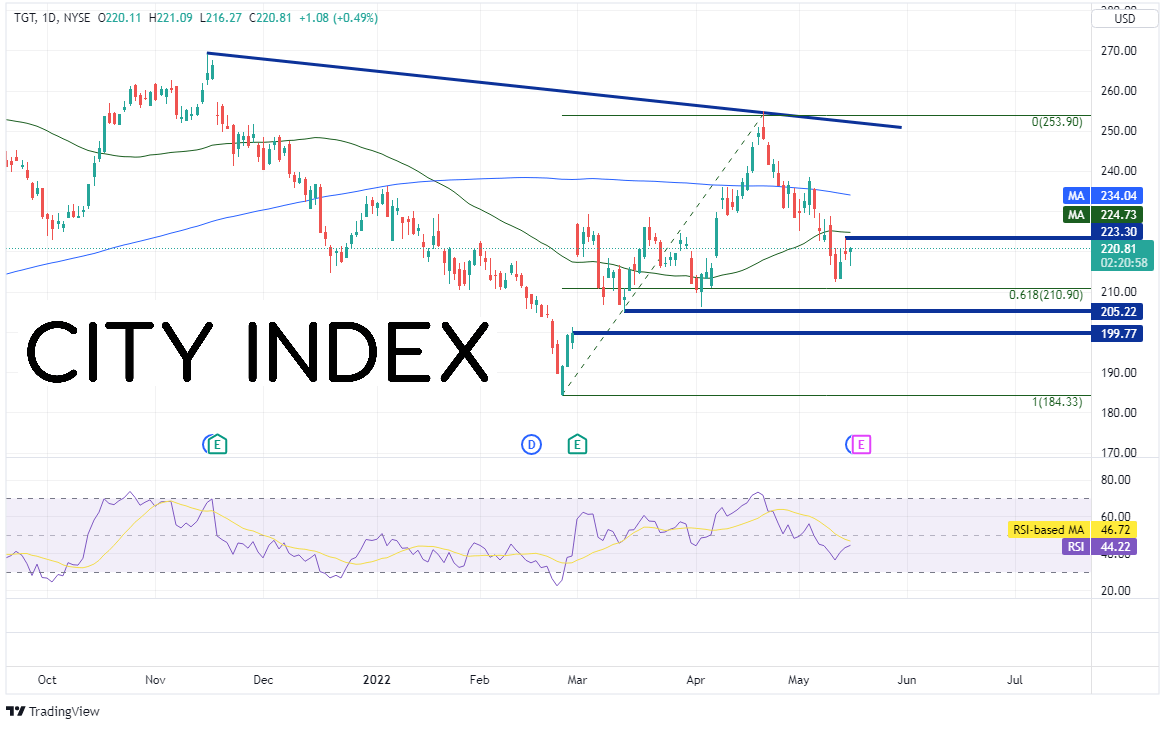
Source: Tradingview, Stone X
You can trade Target shares with City Index in just four easy steps:
1. Open a City Index account, or log-in if you’re already a customer.
2. Search for ‘Target’ in our award-winning platform
3. Choose your position and size, and your stop and limit levels
4. Place the trade
Or you can try out your trading strategy risk-free by signing up for our Demo Trading Account.
Latest market news


Open an account in minutes
Experience award-winning platforms with fast and secure execution, and enjoy tight spreads from 0.5 pts on FX and 0.3 pts on indices.
Economic calendar
Web Trader platform
Our sophisticated web-based platform is packed with features.
Related articles
Dow Jones Slide Shows What Rate Hike Bets Mean for Stocks
The Dow Jones support breakdown shows rising bond yields and rate hike bets hitting U.S. stocks while tech giants prop up the Nasdaq.

EUR/USD forecast remains tilted lower with French bond troubles ahead of US jobs report
The EUR/USD has tagged a fresh year-to-date low as French public-finance concerns trigger a government bond sell-off. Today's US jobs report may change little, with resilient activity, elevated energy prices and hawkish Fed bets keeping the greenback supported. With the pair trapped below resistance at 1.1410, the risk to the near-term EUR/USD forecast is tilted to the downside.

What Stretched 10-Year Yields Mean for Major Currency Pairs in Q4
U.S. 10-year Treasury yields are nearing a long-term resistance zone with overbought RSI readings, raising near-term pullback risk for the dollar.

This report is intended for general circulation only. It should not be construed as a recommendation, or an offer (or solicitation of an offer) to buy or sell any financial products. The information provided does not take into account your specific investment objectives, financial situation or particular needs. Before you act on any recommendation that may be contained in this report, independent advice ought to be sought from a financial adviser regarding the suitability of the investment product, taking into account your specific investment objectives, financial situation or particular needs.
StoneX Financial Pte. Ltd., may distribute reports produced by its respective foreign entities or affiliates within the StoneX group of companies or third parties pursuant to an arrangement under Regulation 32C of the Financial Advisers Regulations. Where the report is distributed to a person in Singapore who is not an accredited investor, expert investor or an institutional investor (as defined in the Securities Futures Act), StoneX Financial Pte. Ltd. accepts legal responsibility to such persons for the contents of the report only to the extent required by law. Singapore recipients should contact StoneX Financial Pte. Ltd. at 6826 9988 for matters arising from, or in connection with the report.
In the case of all other recipients of this report, to the extent permitted by applicable laws and regulations neither StoneX Financial Pte. Ltd. nor its associated companies will be responsible or liable for any loss or damage incurred arising out of, or in connection with, any use of the information contained in this report and all such liability is hereby expressly disclaimed. No representation or warranty is made, express or implied, that the content of this report is complete or accurate.
StoneX Financial Pte. Ltd. is not under any obligation to update this report.
Trading CFDs carries a high level of risk that may not be suitable for some investors. Consider your investment objectives, level of experience, financial resources, risk appetite and other relevant circumstances carefully. The possibility exists that you could lose some or all of your investments, including your initial deposits. If in doubt, please seek independent expert advice. Visit www.forex.com/en-sg/terms-and-policies for the complete Risk Disclosure Statement.