



Two trades to watch FTSE as UK lockdown could get tougher Gold tests key support
FTSE is under pressure at the start of the week. still holds above ascending trend line. Gold tests 200 sma amid a strengthening US Dollar and rising Treasury yields.
Share this:

FTSE under pressure with covid in focus
- The broad mood in the market has soured following unexpectedly weak US non-farm payroll data, which saw payrolls shrink by 140,000.
- Covid cases in the UK continue to surge remaining above 50,000 new daily cases. The UK government is threatening tighter lockdown restrictions.
- The is no major UK data.
FTSE 100 index chart analysis
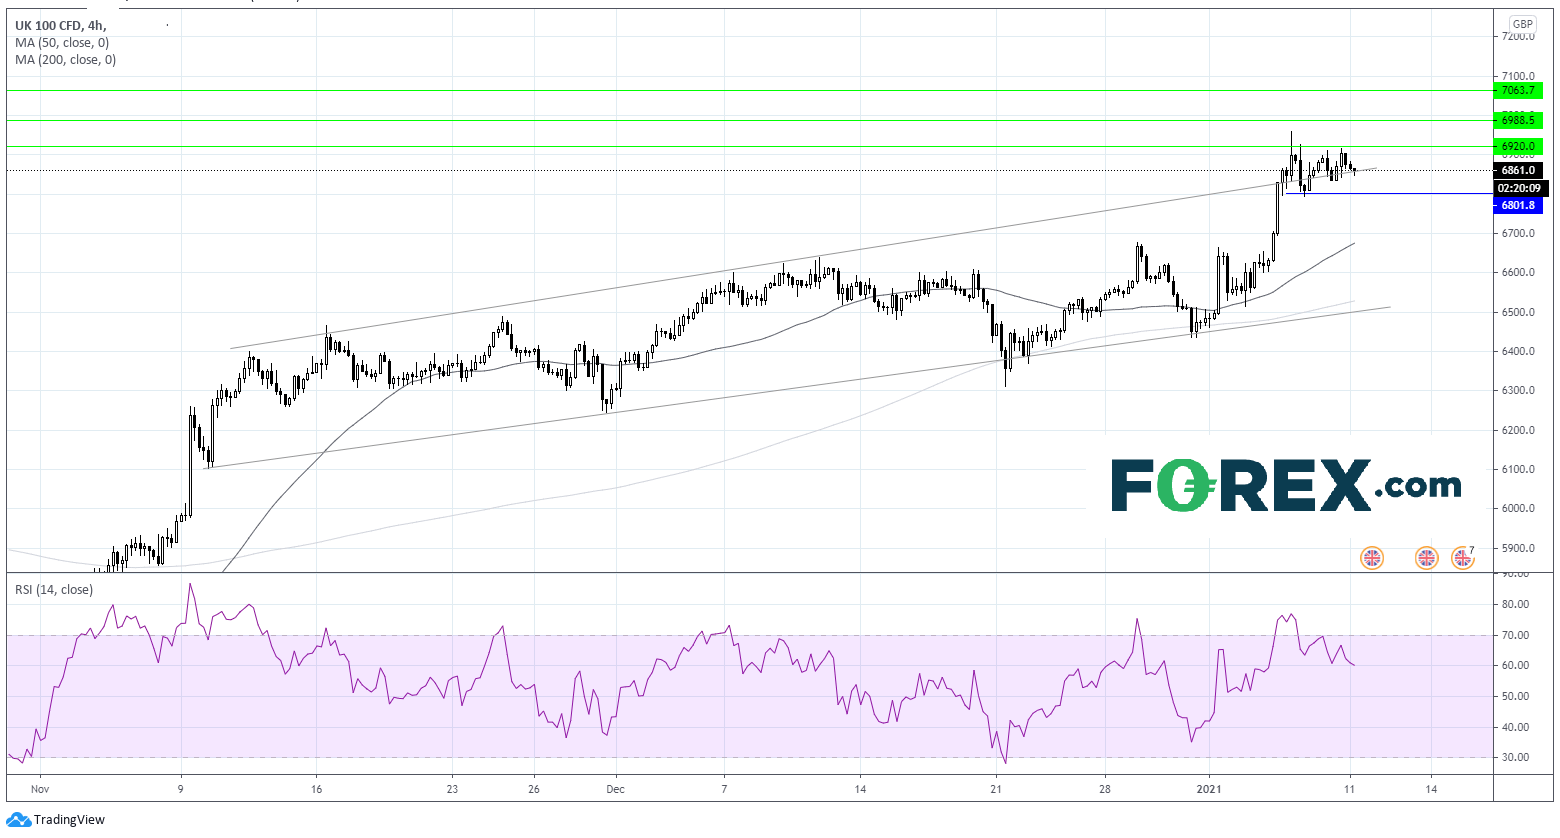
The FTSE is seen consolidating after last week pushing above the upper band of the ascending channel which dates back to early November. So far, since the start of the new year the upside has broadly been capped by 6920, whilst the downside is being held by 6800.
The FTSE is currently trading at 6860, approximately mid-way between this horizontal channel as it tests support of the upper band of the ascending channel. Should it slip below then a retest of 6800 could be on the cards. Acceptance below here could see the 50 sma on the 4 hour chart at 6675 come into play.
Should the support at 6860 hold the FTSE could look to retest 6920 before a move towards 6990.
Learn more about trading indices
Gold rebounds off multi day low, 200 sma in focus
- Gold is extending losses on Monday after a slump of over 4% across the previous session amid a strengthening US Dollar and rising treasury yields.
- US Dollar Index + 0.27% - the US Dollar usually trades inversely to gold as a stronger greenback
- US Treasury yields remain elevated amid growing expectations of additional fiscal stimulus. Weak NFP data added to the case.
Gold chart analysis
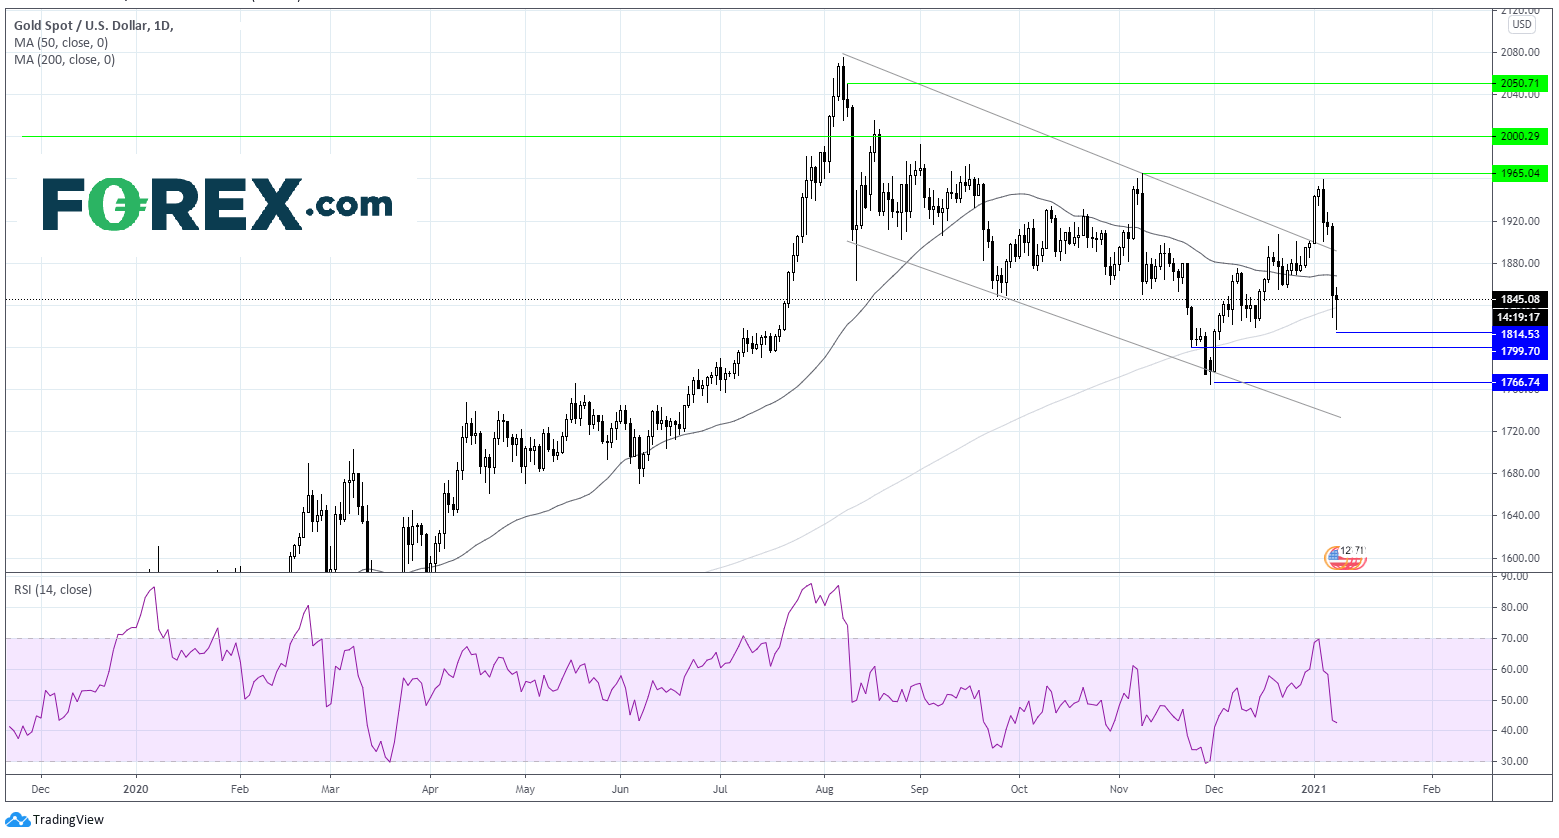
The Gold price failed to maintain a move higher above the descending channel which has been in place since early August, indicating weakness in the p rice above $1900.
The Gold price fell through the key 200 sma on the daily chart on Friday and hit a low of $1817 in early trade on Monday although the move lacked follow through
The precious metal has managed to move back above the 200 sma at 1836. This is remains the key level to watch on the downside before another test of the daily low and the psychological support at $1800. A move toward the November low at $1765 looks unlikely for now.
Should the 200 sma hold a move back towards the 50 sma at $1868 could be on the cards before Gold makes another attempt to move above the upper band of the descending channel at $1895.
Learn more about trading precious metal
FTSE under pressure with covid in focus
- The broad mood in the market has soured following unexpectedly weak US non-farm payroll data, which saw payrolls shrink by 140,000.
- Covid cases in the UK continue to surge remaining above 50,000 new daily cases. The UK government is threatening tighter lockdown restrictions.
- The is no major UK data.
FTSE 100 index chart analysis
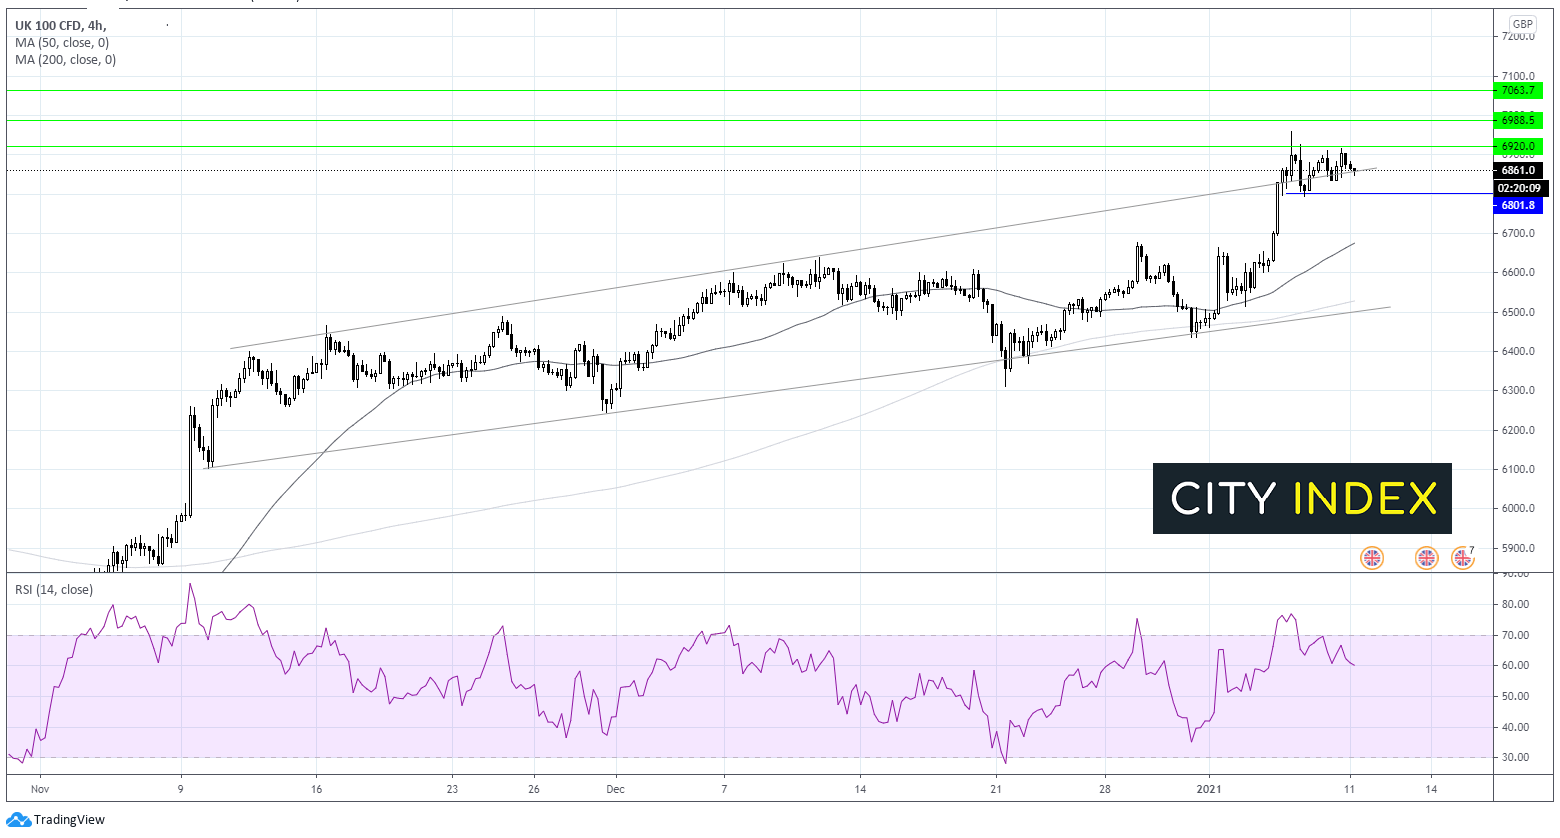
The FTSE is seen consolidating after last week pushing above the upper band of the ascending channel which dates back to early November. So far, since the start of the new year the upside has broadly been capped by 6920, whilst the downside is being held by 6800.
The FTSE is currently trading at 6860, approximately mid-way between this horizontal channel as it tests support of the upper band of the ascending channel. Should it slip below then a retest of 6800 could be on the cards. Acceptance below here could see the 50 sma on the 4 hour chart at 6675 come into play.
Should the support at 6860 hold the FTSE could look to retest 6920 before a move towards 6990.
Learn more about trading indices
Gold rebounds off multi day low, 200 sma in focus
- Gold is extending losses on Monday after a slump of over 4% across the previous session amid a strengthening US Dollar and rising treasury yields.
- US Dollar Index + 0.27% - the US Dollar usually trades inversely to gold as a stronger greenback
- US Treasury yields remain elevated amid growing expectations of additional fiscal stimulus. Weak NFP data added to the case.
Gold chart analysis
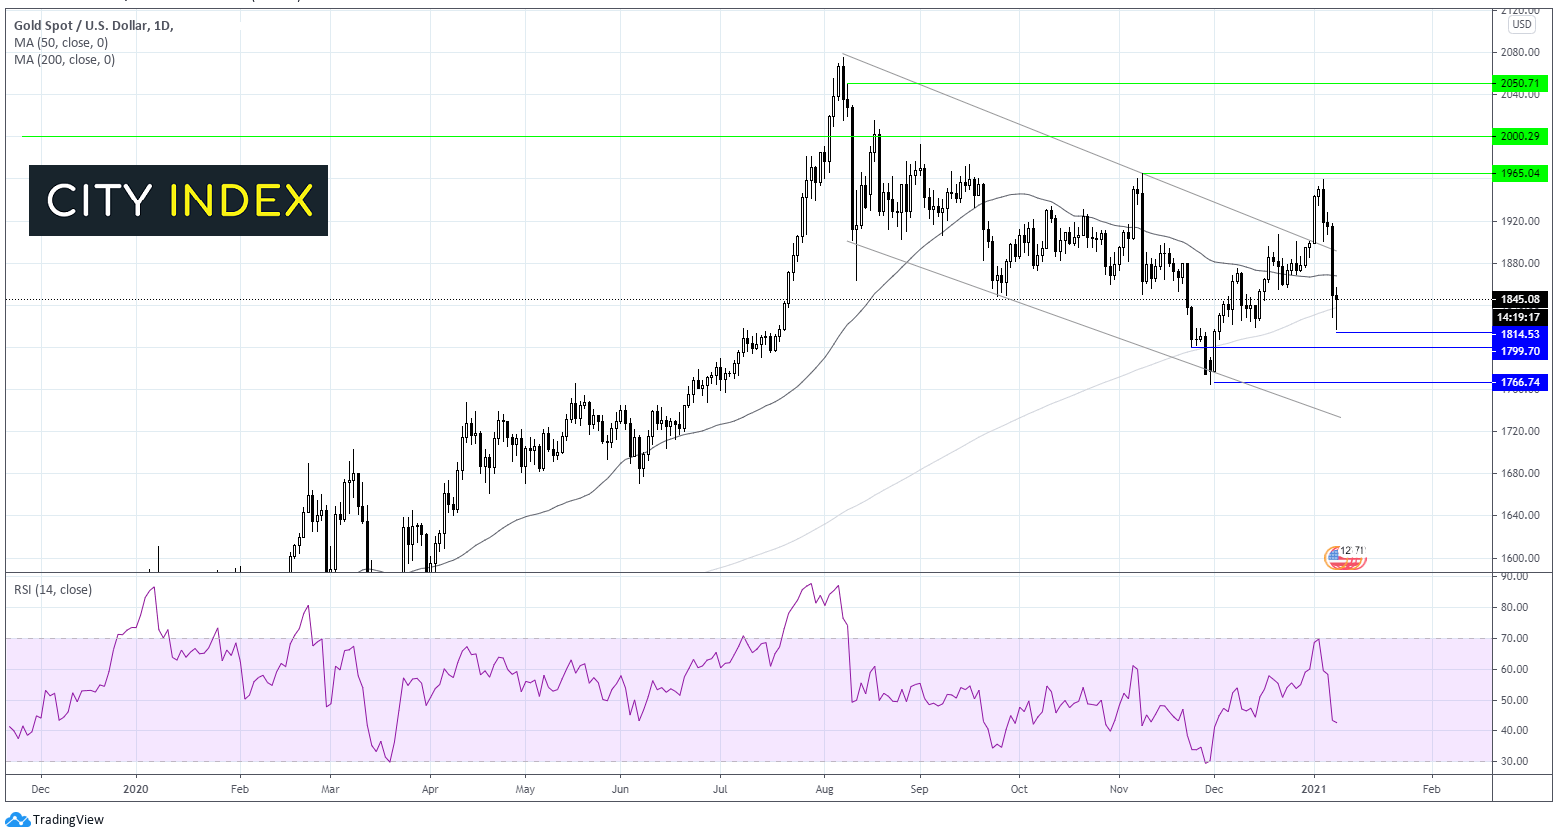
The Gold price failed to maintain a move higher above the descending channel which has been in place since early August, indicating weakness in the p rice above $1900.
The Gold price fell through the key 200 sma on the daily chart on Friday and hit a low of $1817 in early trade on Monday although the move lacked follow through
The precious metal has managed to move back above the 200 sma at 1836. This is remains the key level to watch on the downside before another test of the daily low and the psychological support at $1800. A move toward the November low at $1765 looks unlikely for now.
Should the 200 sma hold a move back towards the 50 sma at $1868 could be on the cards before Gold makes another attempt to move above the upper band of the descending channel at $1895.
Learn more about trading precious metal



Open an account in minutes
Experience award-winning platforms with fast and secure execution, and enjoy tight spreads from 0.5 pts on FX and 0.3 pts on indices.
Economic calendar
Web Trader platform
Our sophisticated web-based platform is packed with features.
Related articles

Gold Update: XAU/USD Remains Under Pressure Even After the NFP Report
As the trading week comes to an end, weakness around gold price action remains evident in the short term. This can be seen in the performance of the past two sessions, where the metal has declined by approximately 0.3%. Although the move has not been particularly aggressive, it highlights that buying pressure continues to struggle to regain control of the market.


Gold Price Forecast: XAU/USD Plunges 12.4% Toward Critical Support 10 1 2026
Softer inflation has revived expectations for a Fed pause, but Friday’s payrolls could put gold’s recovery prospects to the test.


Gold Price Outlook: XAU/USD Resistance at $4200 Sets Up for NFP
It was a strong sell-off to start the week in gold and despite a Tuesday bounce, sellers are continuing to push following a resistance hit at the $4200 level.

This report is intended for general circulation only. It should not be construed as a recommendation, or an offer (or solicitation of an offer) to buy or sell any financial products. The information provided does not take into account your specific investment objectives, financial situation or particular needs. Before you act on any recommendation that may be contained in this report, independent advice ought to be sought from a financial adviser regarding the suitability of the investment product, taking into account your specific investment objectives, financial situation or particular needs.
StoneX Financial Pte. Ltd., may distribute reports produced by its respective foreign entities or affiliates within the StoneX group of companies or third parties pursuant to an arrangement under Regulation 32C of the Financial Advisers Regulations. Where the report is distributed to a person in Singapore who is not an accredited investor, expert investor or an institutional investor (as defined in the Securities Futures Act), StoneX Financial Pte. Ltd. accepts legal responsibility to such persons for the contents of the report only to the extent required by law. Singapore recipients should contact StoneX Financial Pte. Ltd. at 6826 9988 for matters arising from, or in connection with the report.
In the case of all other recipients of this report, to the extent permitted by applicable laws and regulations neither StoneX Financial Pte. Ltd. nor its associated companies will be responsible or liable for any loss or damage incurred arising out of, or in connection with, any use of the information contained in this report and all such liability is hereby expressly disclaimed. No representation or warranty is made, express or implied, that the content of this report is complete or accurate.
StoneX Financial Pte. Ltd. is not under any obligation to update this report.
Trading CFDs carries a high level of risk that may not be suitable for some investors. Consider your investment objectives, level of experience, financial resources, risk appetite and other relevant circumstances carefully. The possibility exists that you could lose some or all of your investments, including your initial deposits. If in doubt, please seek independent expert advice. Visit www.forex.com/en-sg/terms-and-policies for the complete Risk Disclosure Statement.