



US Dollar Price Action: EUR/USD, USD/JPY, SPX, Gold
It’s a market of extremes with the US Dollar pushing for its 12th consecutive weekly gain and the S&P 500 testing below a key spot of confluent support.
Share this:

US Dollar Talking Points:
- The US Dollar has extended its bullish run as the currency works on its 12th consecutive weekly gain. That’s an extreme item on a historical basis and similarly there’s several extremes showing in related markets.
- EUR/USD is trading below a key psychological level and USD/JPY got snapped back from the 150 handle earlier on the day in a move that some are saying comes from intervention, although that hasn’t been confirmed that I’ve been able to find, as of this writing.
- This is an archived webinar that’s free for all to join. If you would like to join the weekly webinar on Tuesdays at 1PM ET, the following link will allow for registration: Click here to register.
Try to think of it from the worse case scenario. If you chase a move and it doesn’t work out, how will you feel about that? Or, conversely, you patiently await a setup and find the support that you wanted to buy, setting a stop on entry as part of your plan. Let’s assume that both trades fail: Which do you feel bad about and which do you feel okay about?
I pose this question up front as there’s several extremes showing in markets right now and the answer to that question could very much determine how you may best want to approach the situation.
Personally, I prefer not to chase. And if I do, when it doesn’t work out, I blame myself, because I let my excitement get the better of my judgement and a loss is how I pay the toll. For some reason those scenarios are more troubling to me than the other, when I patiently wait for my entry and my plan doesn’t work out. Because even if the trade hits a stop, I can feel good about it because I feel that I did my part in sticking to my plan while trying to take a strategic approach towards markets.
One behavior lends itself well to future performance and the other does not. I note this up front because, again, we’re in a market of extremes and there’s no one ‘right’ way to approach it. Some traders chase breakouts. Others wait patiently for support or resistance to plot for trends.
At the source of this extreme is continued strength in the US Dollar, which just finished its 11th consecutive weekly gain. That’s an abnormal stat that doesn’t happen all too often, and the last time it did was now more than a decade ago when the USD was at the early stages of a 25% incline. Of course, that’s but one anecdote, but to see such a consistent string of gains in such an important asset like the US Dollar may be telling us something. I started harping on this in August and it remains in-play today.
Today brought another fresh 2023 high into the mix, with some resistance finally showing up around a swing that was last in-play in December of last year plotted around 107.20. There’s another possible spot of resistance a little higher, around the 108 handle. On the support side of the coin, similar to what I had spoken about in last week’s webinar after the US Dollar had just set that fresh 2023 high, was the prospect of pullback potential with support at prior resistance. For last week, that appeared to show around the prior 2023 high of 105.88. That’s since led to another extension in the trend.
At this point, there’s higher-low support potential at spots of prior resistance. There are points of interest at 106.76, 106.30 and then around 105.69.
US Dollar Four-Hour Price Chart
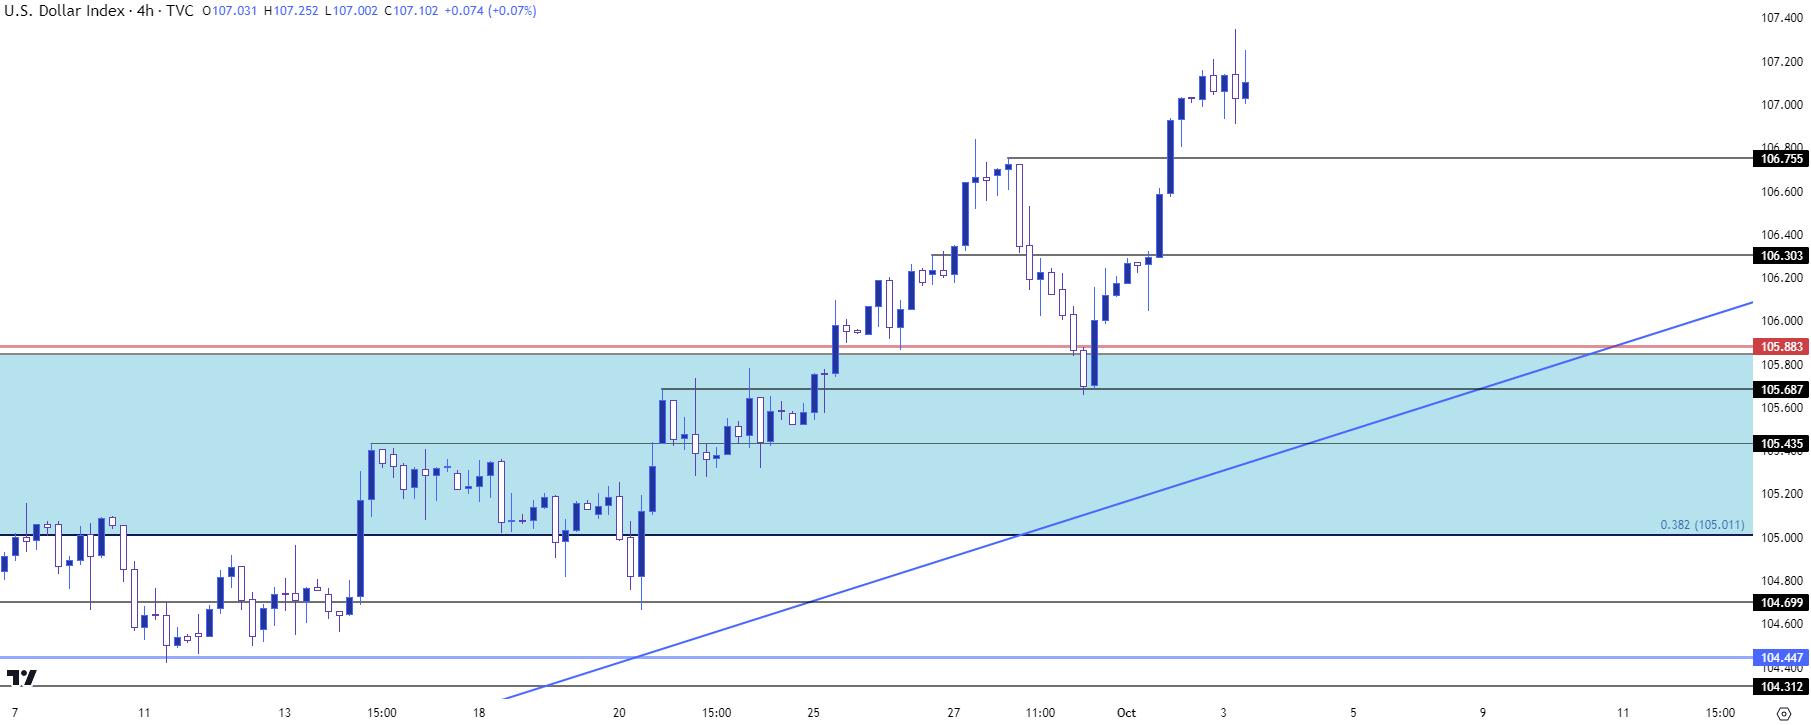
Chart prepared by James Stanley; data derived from Tradingview
USD/JPY
I’ve been open about my opinion on USD/JPY of late as the threat of intervention and the continued dovishness from the BoJ had set up the situation as a subjective matter. The long side of the trade started to feel like ‘picking up pennies in front of a steam roller’ given that intervention threat. And then the short side of the pair was essentially betting on some form of change from the BoJ or perhaps the possibility of intervention. While the long side was in essence a bet that an intervention announcement might not come out soon.
The 150 area is where the reversal in the pair had pitched in last year. But there’s some nuance around that, as it was the softening in US inflation with the USD getting a punch in November that really made that intervention from the BoJ look successful.
We don’t quite have the same backdrop at the moment with the US Dollar as the currency works on its 12th consecutive weekly gain.
The pair re-tested the 150 handle for the first time since last year earlier in today’s session. The move lasted for about 10 minutes above the big figure before price was aggressively slammed lower. This brought about accusations of intervention, but I haven’t been able to confirm that as the case at this point, which isn’t necessarily unusual as the bank may not want to show their hand so clearly.
Getting granular with the levels: The snap back ran all the way down to a prior low at 147.32, which then led to a bounce back up to 149. The carry remains positive, so if we can see some support solidify there could be a return of the bullish argument provided that we’re not right at that 150 level. But, this remains another of those extreme cases, and extreme moves can bring extreme pullbacks as a crowded traded can quickly send traders rushing for the exits on greater evidence of reversal.
USD/JPY Four-Hour Price Chart
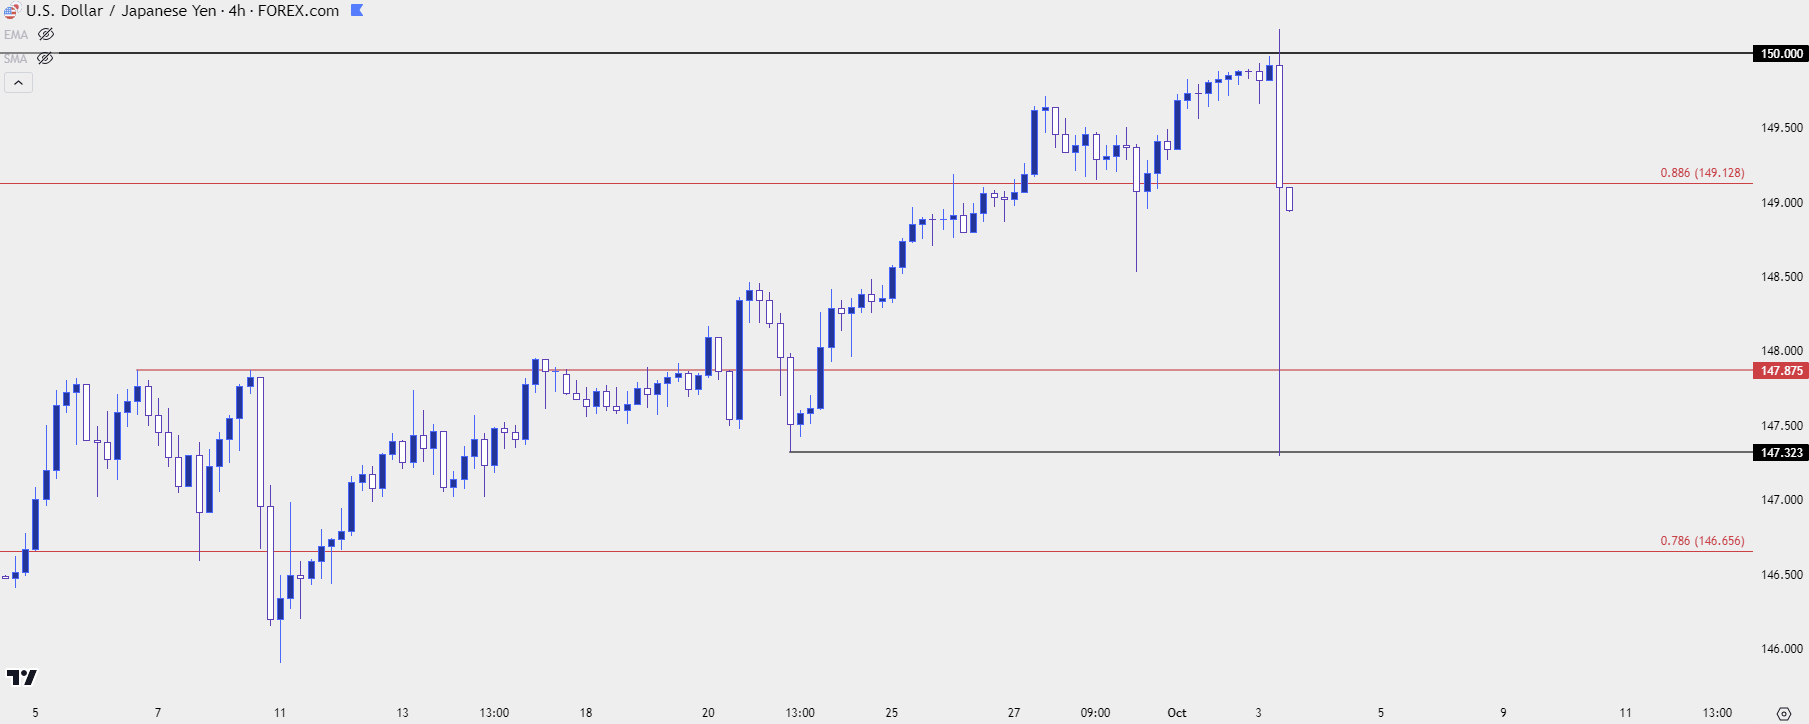
Chart prepared by James Stanley, USD/JPY on Tradingview
EUR/USD 1.0500
Psychological levels can be tricky. When I explain this in a webinar I usually talk about it from the vantage point of a retail operation. Many stores or shops will end prices with 99 cents. The reason is that it can make the product seem cheaper, which could compel you to a greater probability of purchases. Simply put, the price of $0.99 feels much cheaper than just 2% less than $1.01. And the very fact that this could compel human behavior could make 0.99 a more compelling support level than 1.01.
This can work in markets, too. As example, the bullish run in EUR/USD through January of this year made a clean run up to the 1.1000 handle, where it then traded for one day. And then prices snapped back to support in the 1.05’s. Of course not every psychological resistance test will lead to 500 pip move but this dynamic can appear on numerous time frames.
Last week I was talking up the 1.0500 level in EUR/USD which ended up coming into play shortly after. Sellers took a couple of shots but couldn’t substantiate much drive below the big figure. This eventually allowed for pullback to the 1.0611 Fibonacci level, which held the highs on Friday and led to another run from bears.
For this instance, however, sellers were able to push prices below the 1.0500 handle where they sit as of this writing. This could be a challenging spot to chase the move considering the lack of recent price action below that figure. That can make chasing the move lower a daunting prospect and, instead, points to resistance potential at that 1.0500 level (if bears remain very aggressive) or perhaps up to 1.0536 which was the higher-low from March trade.
EUR/USD Four-Hour Price Chart
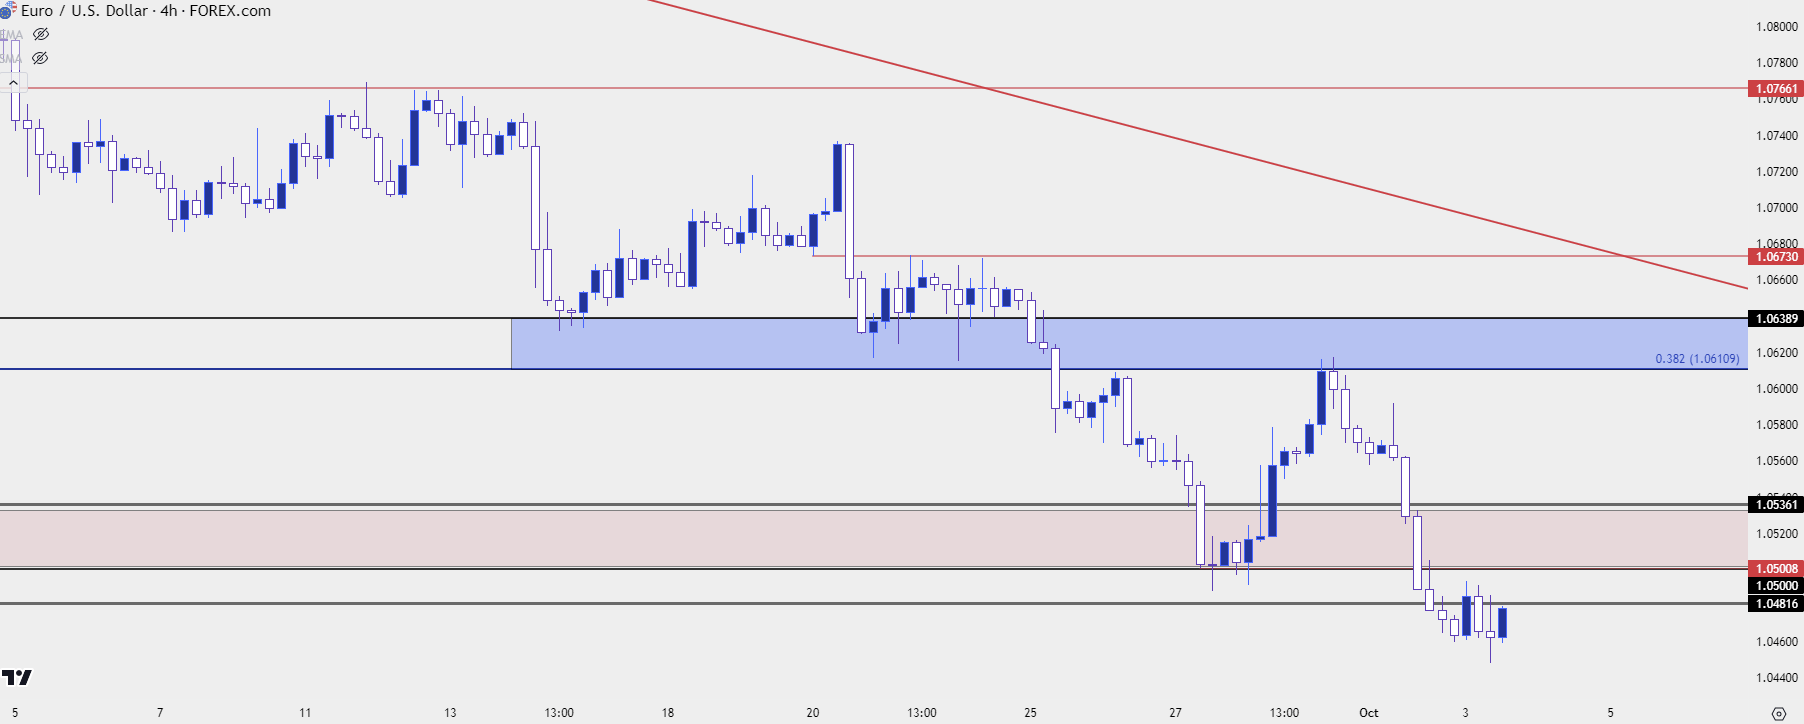
Chart prepared by James Stanley, EUR/USD on Tradingview
SPX
Stocks remain on their back foot, and I had looked into equities during the webinar to highlight a number of support items that bulls haven’t yet shown much response to.
Also of issue is the comparison across markets – where the US Dollar is trading well-above it’s March high, as are US Treasury yields. When I had noted this last week I also highlighted the difference in gold, which I’ll address in our next section.
In the S&P 500, the daily chart has shown all of a trendline test as taken from the October and March lows, along with a 200 day moving average test and the first re-entry into oversold conditions since a couple of weeks before the index had bottomed last year. This all came together last week and it did help to stall the sell-off, but with the move today bears are pushing fresh near-term lows and that raises more questions about the lack of response to so many support mechanisms.
This is another of those extremes, as stocks are showing oversold readings while trading at fresh multi-month lows. For next support, I’m tracking the 4204 level as that’s a measured move from the double top formation.
S&P 500 Daily Price Chart (indicative only, not available on Forex.com platforms)
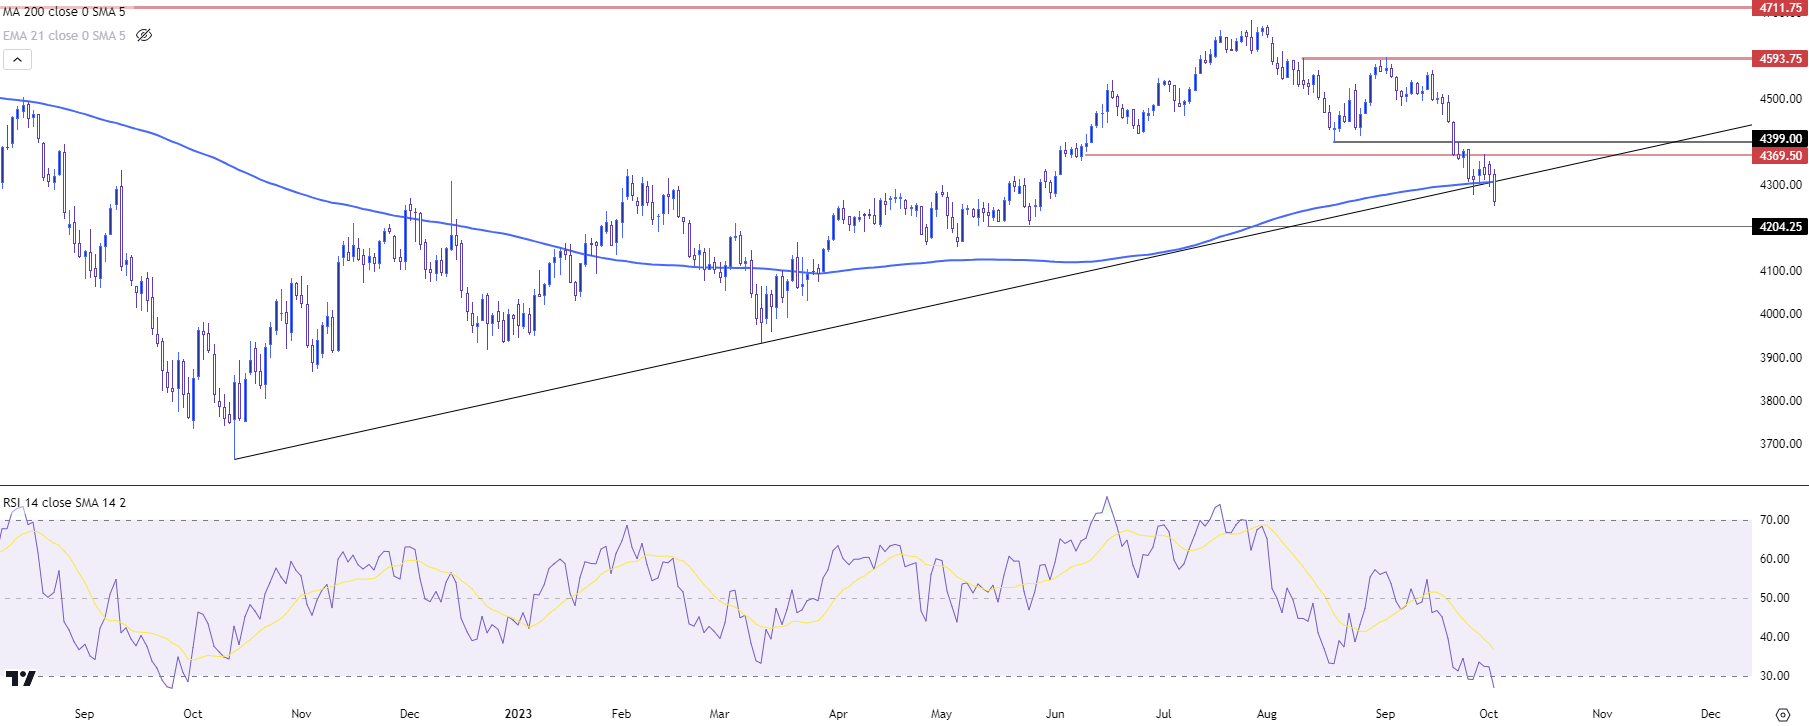
Chart prepared by James Stanley; data derived from Tradingview
Gold
This is where the pain of the post-FOMC theme can really be seen. Spot gold just had its largest weekly loss in more than two years, and RSI on the daily chart is at its most oversold since August of 2018.
When I looked at gold in last week’s webinar I had remarked on that difference between yields and the US Dollar and gold. Gold prices were still well-above their prior March lows even as both the USD and Treasury yields had eclipsed those levels.
The pain in gold really showed last week and at this point prices are much closer to that prior March low. The complication is, again, another one of those extremes as the market is deeply oversold but there’s been a very obvious reason for the move, as US Treasury yields continue to climb on the long-end of the curve.
For resistance, there’s lower-high resistance potential around the 1848 Fibonacci level, but with prior support all the way up to 1885 there’s a few other areas that sellers can pick on if bulls can evoke a push above 1850.
Gold (XAU/USD) Daily Price Chart
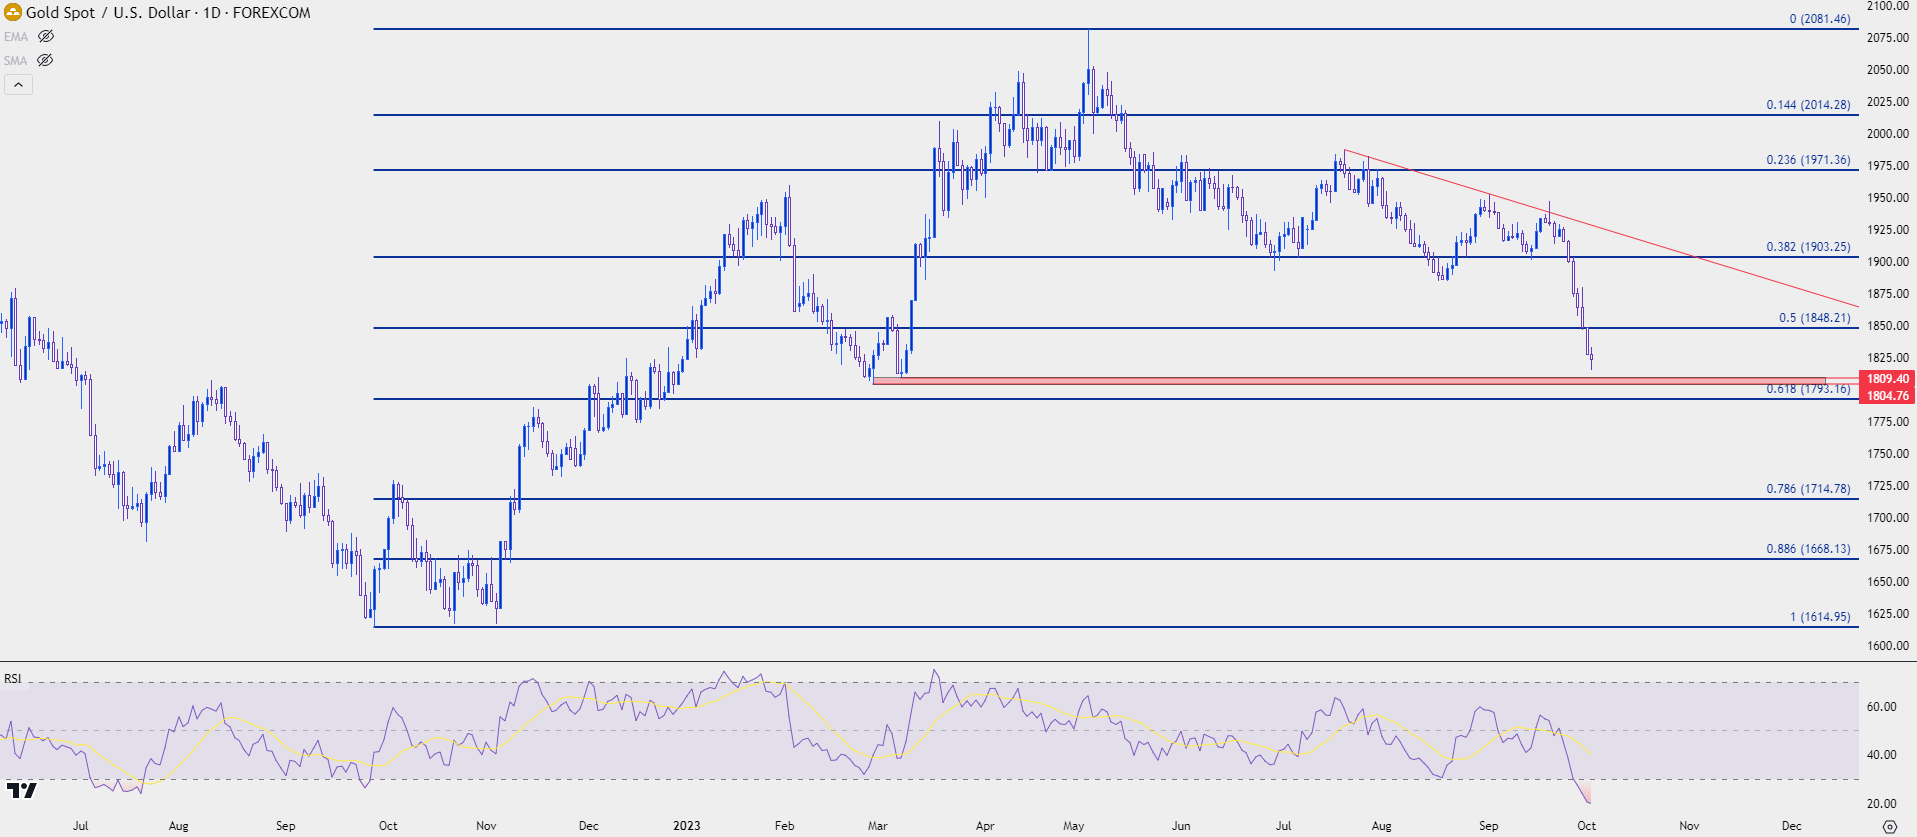
Chart prepared by James Stanley, Gold on Tradingview
--- written by James Stanley, Senior Strategist

Open an account in minutes
Experience award-winning platforms with fast and secure execution, and enjoy tight spreads from 0.5 pts on FX and 0.3 pts on indices.
Economic calendar
Web Trader platform
Our sophisticated web-based platform is packed with features.
Related articles

USD/JPY falters, EUR/USD awaits French bond verdict
The yen has reacted to falling US yields, but the euro faces a different problem. Could French government bond yields provide the additional push needed to break EUR/USD's downtrend?

Gold Bears Approach Major Support, USD/CHF Eyes Reversal
Gold bears approach major support around $4,000, while USD/CHF shows signs of a bearish reversal. Middle East tensions add to market uncertainty.


EUR/USD Forecast: Euro Remains Under Pressure Amid Concerns Over French Debt
Recent trading sessions continue to present a challenging environment for the euro in the short term. This can be seen in the performance of EUR/USD, which has declined by approximately 0.5%, reflecting another loss of ground for the European currency and highlighting the continued strength of the U.S. dollar.

This report is intended for general circulation only. It should not be construed as a recommendation, or an offer (or solicitation of an offer) to buy or sell any financial products. The information provided does not take into account your specific investment objectives, financial situation or particular needs. Before you act on any recommendation that may be contained in this report, independent advice ought to be sought from a financial adviser regarding the suitability of the investment product, taking into account your specific investment objectives, financial situation or particular needs.
StoneX Financial Pte. Ltd., may distribute reports produced by its respective foreign entities or affiliates within the StoneX group of companies or third parties pursuant to an arrangement under Regulation 32C of the Financial Advisers Regulations. Where the report is distributed to a person in Singapore who is not an accredited investor, expert investor or an institutional investor (as defined in the Securities Futures Act), StoneX Financial Pte. Ltd. accepts legal responsibility to such persons for the contents of the report only to the extent required by law. Singapore recipients should contact StoneX Financial Pte. Ltd. at 6826 9988 for matters arising from, or in connection with the report.
In the case of all other recipients of this report, to the extent permitted by applicable laws and regulations neither StoneX Financial Pte. Ltd. nor its associated companies will be responsible or liable for any loss or damage incurred arising out of, or in connection with, any use of the information contained in this report and all such liability is hereby expressly disclaimed. No representation or warranty is made, express or implied, that the content of this report is complete or accurate.
StoneX Financial Pte. Ltd. is not under any obligation to update this report.
Trading CFDs carries a high level of risk that may not be suitable for some investors. Consider your investment objectives, level of experience, financial resources, risk appetite and other relevant circumstances carefully. The possibility exists that you could lose some or all of your investments, including your initial deposits. If in doubt, please seek independent expert advice. Visit www.forex.com/en-sg/terms-and-policies for the complete Risk Disclosure Statement.