



US Dollar Price Action into CPI: EUR/USD, GBP/USD, USD/JPY
US Dollar strength has continued and notably the NFP print was a ‘choose your own adventure’ type of story, with Dollar bulls retaining control around the print. For next week the focus shifts squarely on to inflation data with the release of US CPI on Tuesday.
Share this:

US Dollar
US Dollar bulls are continuing to push and this week saw the break of an ascending triangle formation that brewed from lows established around the Christmas holiday. The GDP print released in December brought question to whether the Fed would be leaning towards more rate cuts, and the Atlanta GDP Now estimation indicated that we could be in for another quarter of strong growth numbers, further fueling the question as to whether the U.S. economy is in dire need of more accommodation at this point.
For Non-farm Payrolls, this was very much a ‘choose your own adventure’ type of story, as the headline number missed the expectation, printing at +50k against an expectation of +60k, but the unemployment rate was better than expected at 4.4% v/s 4.5% expected and Average Hourly Earnings was hot at 3.8% against a 3.6% expectation.
As such, the initial reaction was somewhat messy in DXY, but a key level held the lows at 98.98 and then bulls went on to drive a continued breakout from the ascending triangle formation that had formed from the lows established around the holiday.
U.S. Dollar Four-Hour Chart
Chart prepared by James Stanley; data derived from Tradingview
US Dollar Big Picture
The path forward isn’t necessarily simple for bulls although there is a silver lining given the hold of support following the December sell-off. That support came in at a Fibonacci level of note at 97.94, and this can qualify as a higher-low above the September swing-low. But, for buyers to retain control they’re going to need to push up to a fresh high, and that’s where the proverbial plot thickens as the resistance in the USD last year is at an imposing spot of prior support, taken from around the 100-100.22 zone.
For that theme to come to fruition we’ll likely need some assistance from stronger-than-expected CPI, and this is something that could still face headwind as President Trump has the FOMC Chair nomination in his back pocket to help soften the Dollar in rally scenarios.
But there’s also the role of counterparts which is a noteworthy item considering the DXY basket is but a basket of underlying currencies, and if the US Dollar is going to break out, it’s going to need some help from counterparts such as the Euro or Japanese Yen.
US Dollar Weekly Chart
Chart prepared by James Stanley; data derived from Tradingview
EUR/USD
The Euro is 57.6% of the DXY quote so if we are to see the DXY basket trend, it’ll likely need at least some participation from the single currency. At this point, the weekly chart has continued to show stall at a massive area, from between the 76.4 and 78.6% Fibonacci retracements of the 2021-2022 major move.

It was just two weeks into last year that EUR/USD found support at the 23.6% marker of that same study, around the 1.0200 handle, and it took a little more than a month but that support soon led into reversal as a bullish breakout took over in March and ran through the end of H1.
But since then, bulls haven’t been able to do much and price remains at the same resistance zone that came into play more than six months ago.
EUR/USD Weekly Chart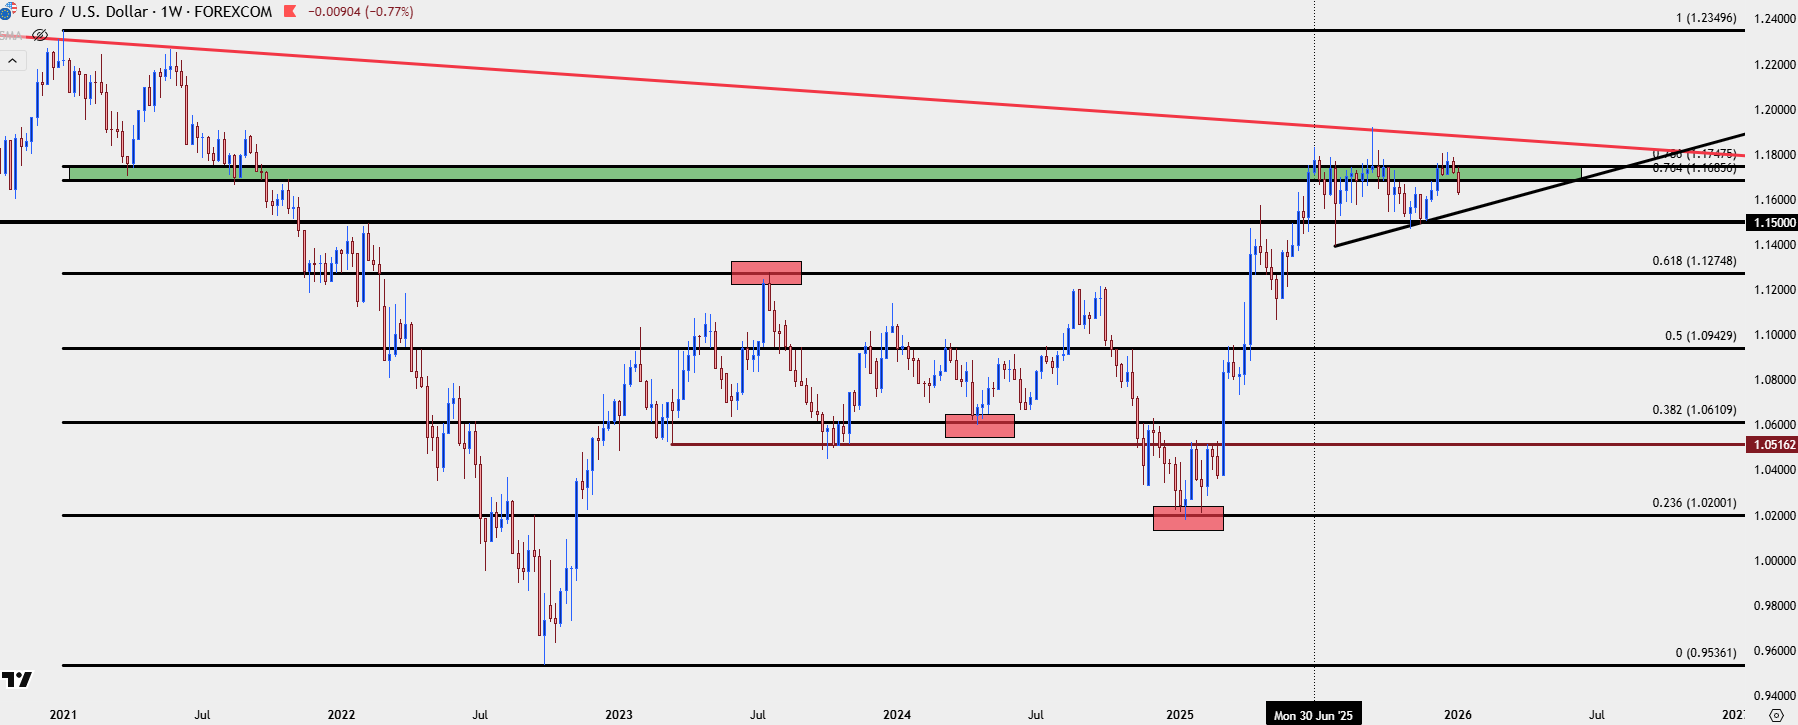
Chart prepared by James Stanley; data derived from Tradingview
EUR/USD Shorter-Term
I looked into this setup on Thursday, ahead of the NFP print and the 1.1616 level has so far held the lows. The question now is whether sellers show up to show resistance at lower-highs, and there’s a few spots of note for such a scenario. Nearby is prior support (from previous resistance) at 1.1656-1.1669. Just above that, we have those longer-term Fibonacci levels, plotted at 1.1686 and 1.1748, respectively. And in-between those two prices is another Fibonacci level at 1.1717.
EUR/USD Daily Chart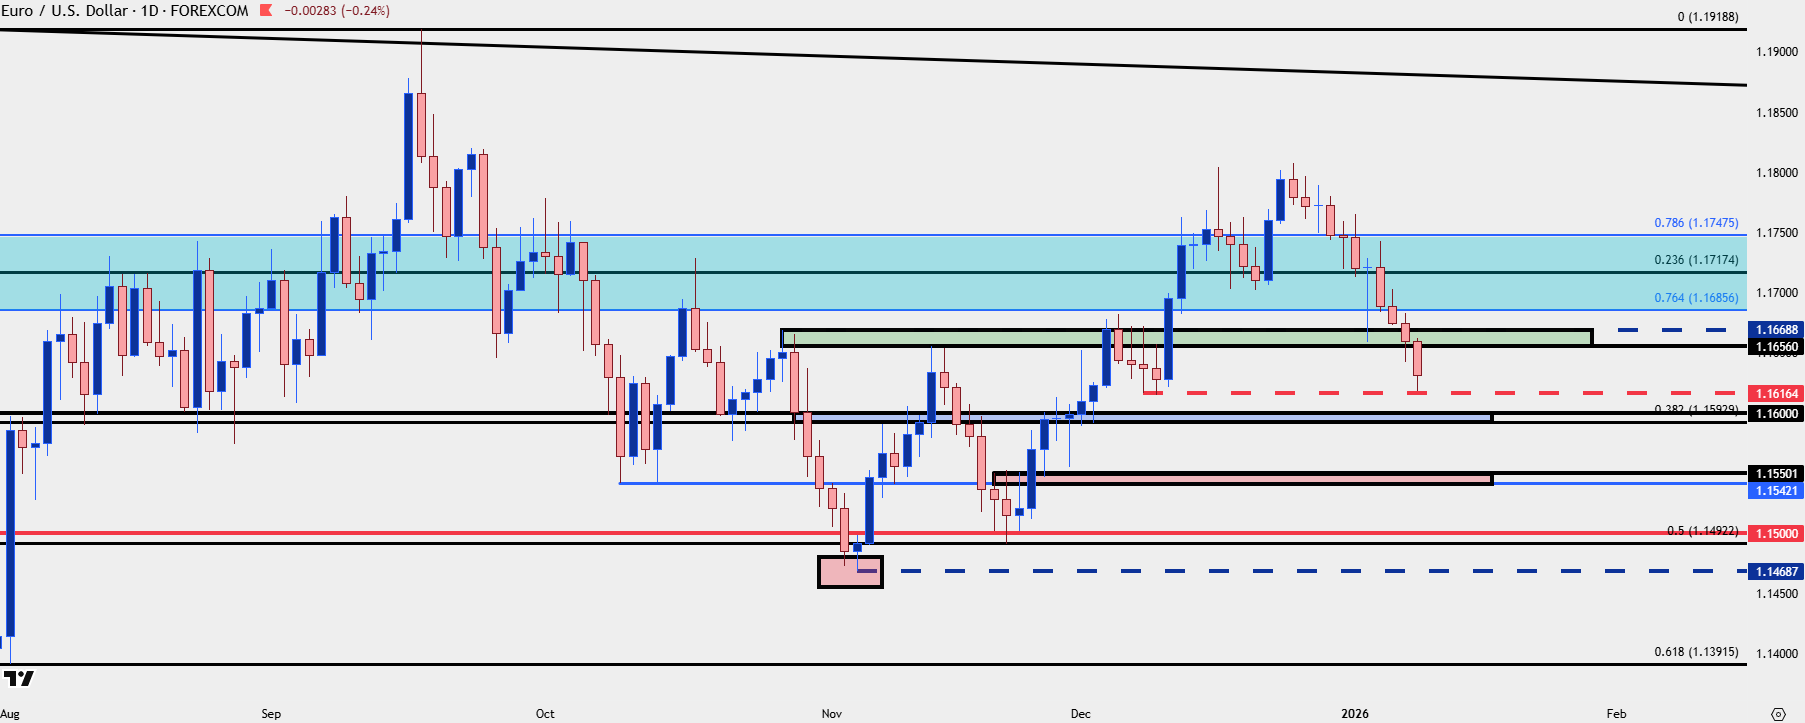
Chart prepared by James Stanley; data derived from Tradingview
GBP/USD
For USD-weakness setups I still favor Cable and this week’s backdrop further illustrates a reason why. As EUR/USD dipped down with a continued sell-off, GBP/USD has held up a bit better and comparatively, that makes the pair as a more attractive venue should USD-bears prevail, in my opinion.
With that said, there could be other ways to trade that theme, such as against the Yen and as looked at in the Tuesday webinar, GBP/JPY has pushed up towards highs after a clean test of support.
In the major of GBP/USD, price still seems to be looking for a low and as of this writing there’s a test below the 1.3414 Fibonacci level. If bulls show up to close price above by the end of the week, that could qualify as support defense; but if they don’t, then there’s a deeper spot of support potential around 1.3355-1.3371, and like we saw this week with the initial re-test of 1.3414, that early sell-off and show of support can lead to a bullish swing setup.
GBP/USD Daily Chart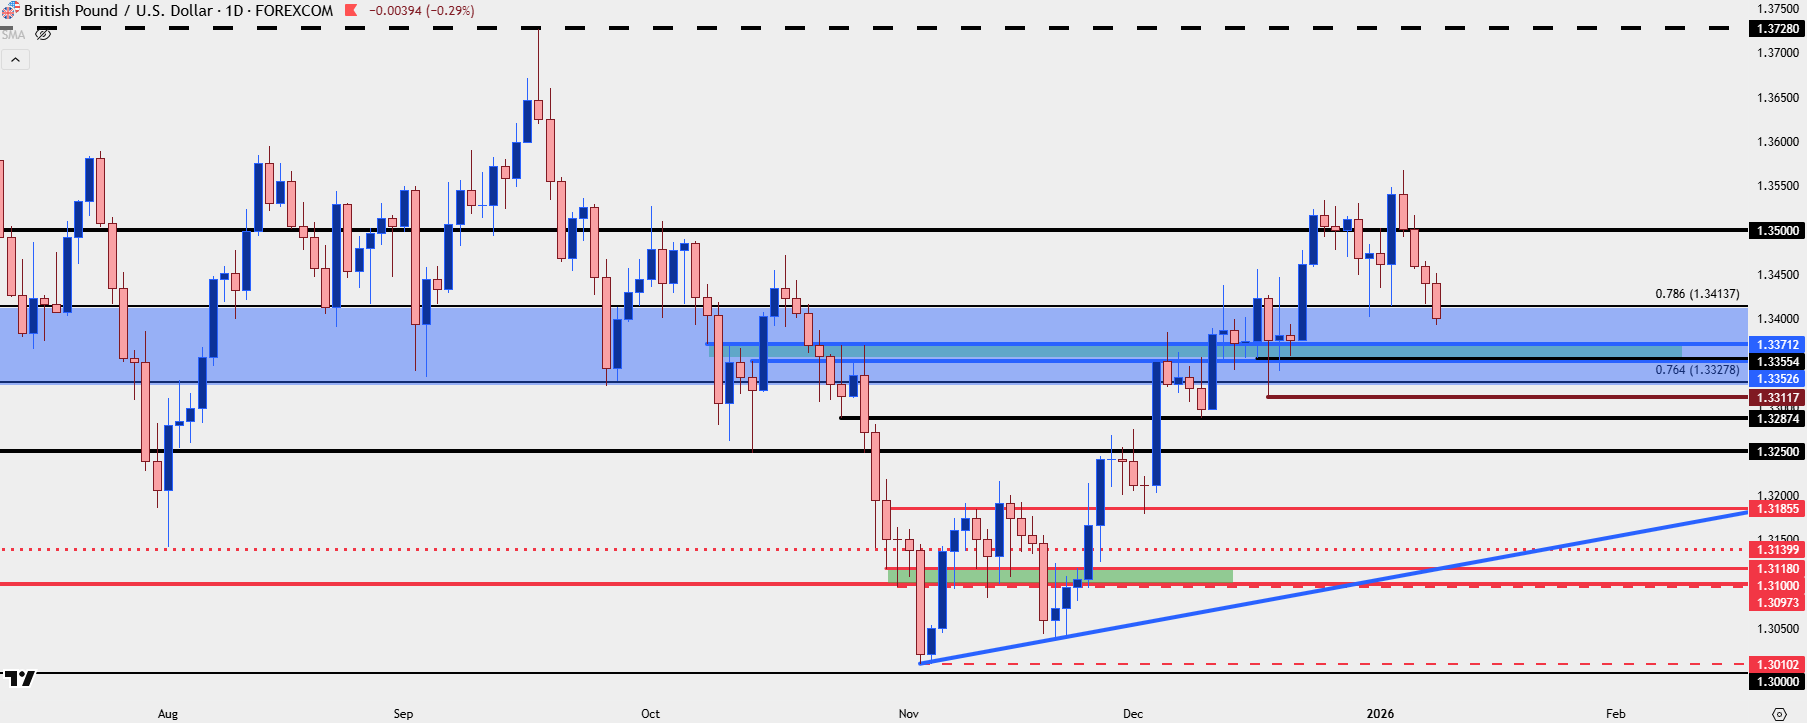
Chart prepared by James Stanley; data derived from Tradingview
USD/JPY
For long-USD setups I’ve been tracking USD/JPY and this week saw a clean backdrop as price is now trading close to a fresh yearly high. This is a tough market to chase, however, as the pair has been prone to bull traps on breakouts, and getting closer to the 160.00 level raises the stakes of a possible intervention threat from the Ministry of Finance.
For this week, however, the setup remained clean, and pullbacks to support are still an attractive way to approach the pair.

That theme played well in December, with a couple of different tests and reactions to the 154.45 prior resistance level, and that’s since been followed by support hits at 155.54 and, more recently, 156.20.
In the Tuesday webinar I lined this up and I took a granular approach towards the matter, highlighting how, ideally, bulls would come in ahead of a re-test of 156.20. The line I had drawn in the sand was around 156.30 and that’s precisely what played shortly after, leading to the rally up to the 158.00 level.
For next week, the big spot of support is the Fibonacci level at 157.17 and 50 pips below that, 156.67. Both prices could justify bullish continuation as higher-lows given recent structure.
And, for those that would like to avoid the USD altogether, the option of using the strength in GBP or perhaps even the potential for strength in the Euro meshed against the Japanese Yen in GBP/JPY or EUR/JPY remains an option.
USD/JPY Four-Hour Price Chart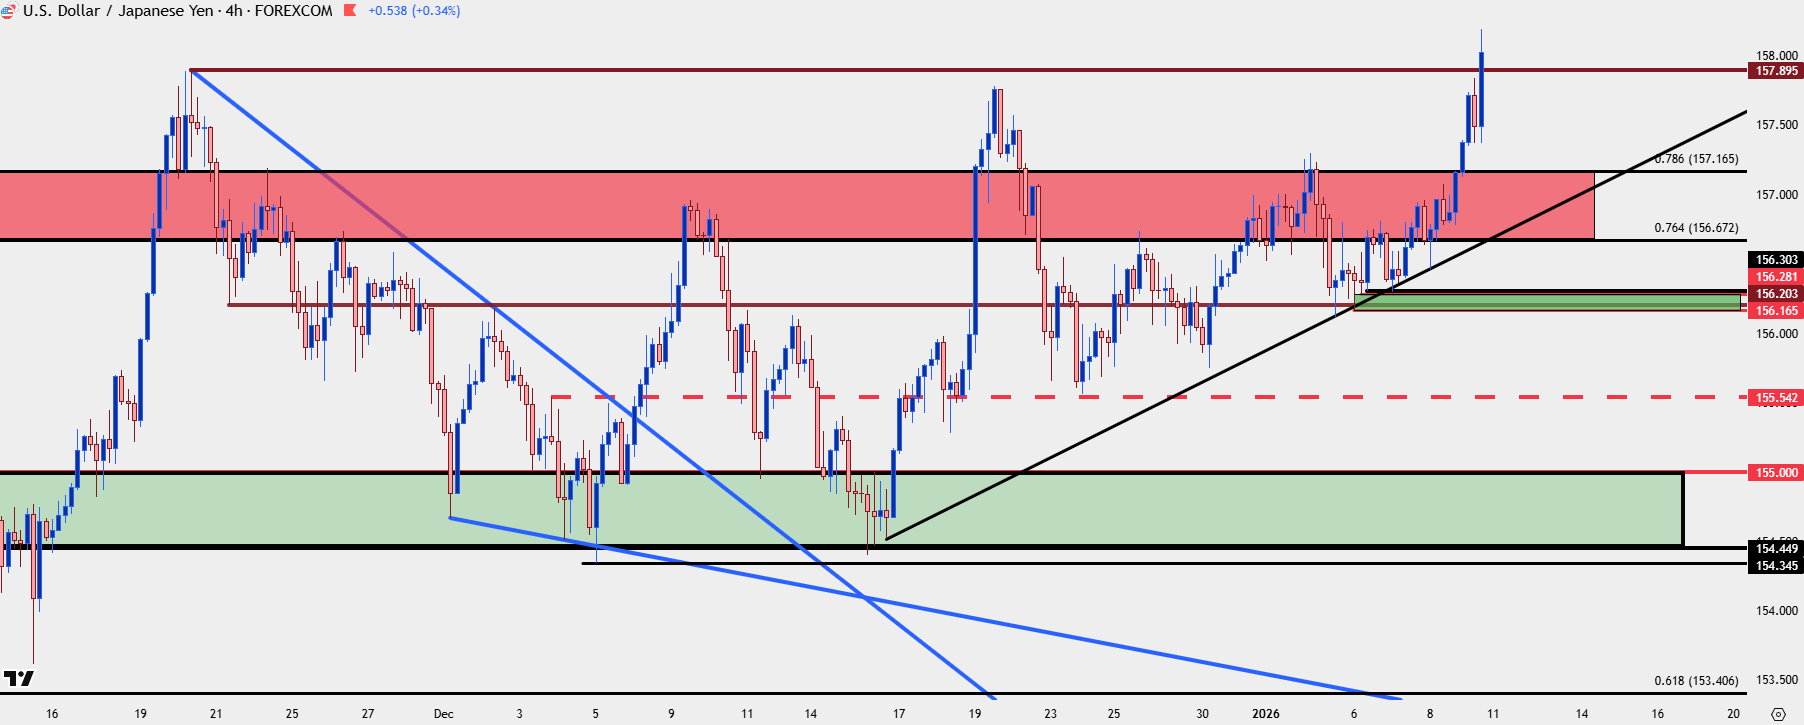
Chart prepared by James Stanley; data derived from Tradingview
--- written by James Stanley, Senior Market Analyst, Global Macro


Open an account in minutes
Experience award-winning platforms with fast and secure execution, and enjoy tight spreads from 0.5 pts on FX and 0.3 pts on indices.
Economic calendar
Web Trader platform
Our sophisticated web-based platform is packed with features.
Related articles

USD/CAD Knocked from Its Perch as US Dollar Rally Pauses for Breath
USD/CAD retreats from stretched highs as the US dollar rally cools, with softer yields, Canadian trade strength and crude oil in focus.

US Dollar Price Action Setups: EUR/USD, GBP/USD, USD/JPY, USD/CAD, Gold
The US Dollar hit a fresh yearly high and is currently testing above a major level, but EUR/USD has already pushed into extreme territory and that begs the question around continuation potential in each market. Meanwhile, USD/JPY retains bullish short-term structure.

USD/CAD Forecast: Is the Canadian Dollar Back in the Game?
The trading week continues to unfold, and the Canadian dollar has begun to show signs of renewed strength in the short term. This can be seen in recent USD/CAD price action, with the pair posting a decline of roughly 0.2% over the last two sessions, allowing the Canadian currency to recover part of the ground lost in previous weeks.

This report is intended for general circulation only. It should not be construed as a recommendation, or an offer (or solicitation of an offer) to buy or sell any financial products. The information provided does not take into account your specific investment objectives, financial situation or particular needs. Before you act on any recommendation that may be contained in this report, independent advice ought to be sought from a financial adviser regarding the suitability of the investment product, taking into account your specific investment objectives, financial situation or particular needs.
StoneX Financial Pte. Ltd., may distribute reports produced by its respective foreign entities or affiliates within the StoneX group of companies or third parties pursuant to an arrangement under Regulation 32C of the Financial Advisers Regulations. Where the report is distributed to a person in Singapore who is not an accredited investor, expert investor or an institutional investor (as defined in the Securities Futures Act), StoneX Financial Pte. Ltd. accepts legal responsibility to such persons for the contents of the report only to the extent required by law. Singapore recipients should contact StoneX Financial Pte. Ltd. at 6826 9988 for matters arising from, or in connection with the report.
In the case of all other recipients of this report, to the extent permitted by applicable laws and regulations neither StoneX Financial Pte. Ltd. nor its associated companies will be responsible or liable for any loss or damage incurred arising out of, or in connection with, any use of the information contained in this report and all such liability is hereby expressly disclaimed. No representation or warranty is made, express or implied, that the content of this report is complete or accurate.
StoneX Financial Pte. Ltd. is not under any obligation to update this report.
Trading CFDs carries a high level of risk that may not be suitable for some investors. Consider your investment objectives, level of experience, financial resources, risk appetite and other relevant circumstances carefully. The possibility exists that you could lose some or all of your investments, including your initial deposits. If in doubt, please seek independent expert advice. Visit www.forex.com/en-sg/terms-and-policies for the complete Risk Disclosure Statement.