


S&P 500 breakout puts 8,000 in sight
Fresh record highs, supportive seasonality and earnings season just ahead leave the S&P 500 bulls with plenty in their favour, even as narrowing breadth argues against getting too carried away.
Share this:

- S&P 500 breaks above August record high
- Bullish momentum builds as 8,000 comes into view
- Quarter-turn history favours stronger post-quarter-end returns
- Narrow breadth warns, but rarely signals imminent reversal
The S&P 500 has broken to fresh record highs, with bullish technicals and historically supportive quarter-turn seasonality pointing to scope for further upside as earnings season approaches. Narrowing breadth remains the key concern, but history suggests it has been more of a drag on the pace of gains than a reliable signal that the broader uptrend is about to reverse.
S&P 500 technicals remain firmly bullish
Source: TradingView
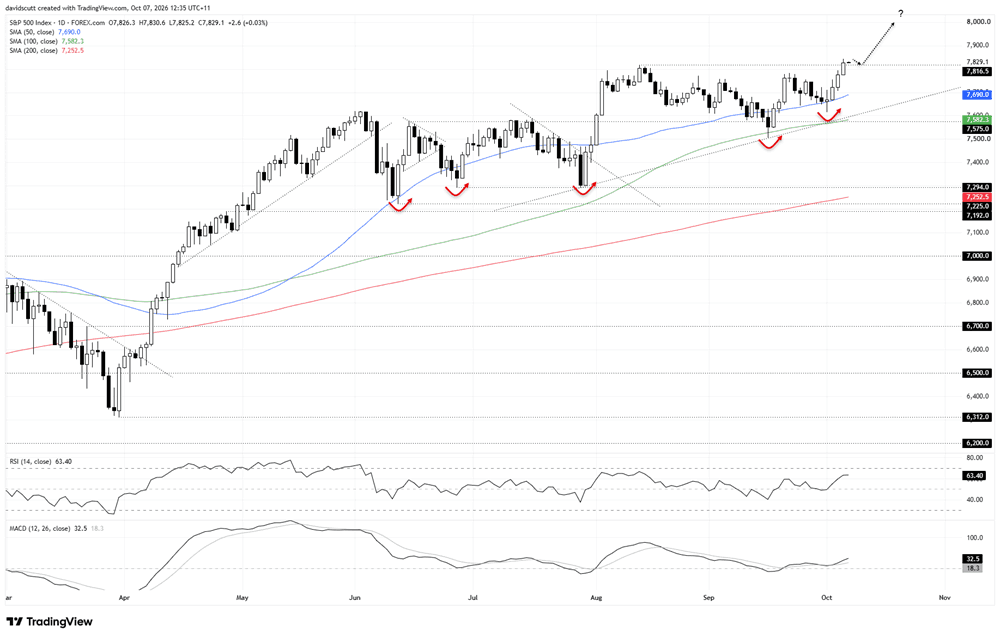
From a technical perspective, the S&P 500 continues to print a series of higher lows stretching back to June, with the latest formed in late September after the price briefly slipped below the 50-day moving average.
That low sparked a strong rebound into early October, with the price now breaking above the previous record high of 7,816.5 set on August 13.
Momentum is strengthening alongside the breakout. RSI (14) has pushed further above 50 to a fresh swing high, while MACD has staged a bullish crossover in positive territory and continues to diverge from its signal line.
The price also remains above its key medium and long-term moving averages, all of which carry a positive slope. However you slice it, at the index level the technical picture remains constructive for bulls.
Should the price hold above 7,816.5, particularly following a successful backtest and bounce from the former record high, it may embolden bulls to look for an extension of the rebound towards the psychological 8,000 level. If that plays out, longs can be set above 7,816.5 with a tight stop beneath for protection against reversal.
However, if the breakout were to reverse back beneath 7,816.5 and hold there, it would open the door for short setups to be considered against the prevailing longer-term trend. Positions could be set beneath the level with a tight stop above for protection, initially targeting the 50-day moving average and, beyond that, the confluence of the 100-day moving average with the minor uptrend running from the late-July lows, found today around 7,600.
And with earnings season approaching and the quarter turn now behind us, seasonal patterns suggest the latest breakout may still have room to run.
Quarter turns have been kind to bulls
Looking at the daily chart above over the course of this year, what stands out is the strength of the rallies that followed each of the prior quarter turns, both of which came ahead of earnings season.
While a sample size of two is hardly enough to make a bullish case, as things currently stand the latest rebound broadly mirrors what we saw following the prior quarter turns this year.
Indeed, looking back to September 2006, there is a noticeable tendency for the S&P 500 to deliver stronger returns after quarter end than would normally be expected following an ordinary month end.
Across 80 completed quarter ends, the S&P 500 delivered an average return of 0.31% after five sessions, 0.93% after 10, 1.28% after 15 and 1.61% after 20. The index was higher 64%, 70%, 72% and 72% of the time respectively.
That compares with average returns of 0.21%, 0.27%, 0.14% and 0.32% over the same horizons following ordinary month ends, suggesting the period immediately after quarter end has historically delivered stronger returns than usual.
As to why the pattern may exist, it’s difficult to look past earnings season, particularly when it’s become synonymous with delivering a torrent of upside surprises relative to consensus forecasts.
According to FactSet analysis released earlier this year, across the past 40 quarters, actual S&P 500 earnings growth has finished above the consensus estimate in place at quarter end on 37 occasions.
In other words, earnings season has almost always delivered better-than-expected results, even allowing for the usual game of conservative guidance and estimates being revised lower ahead of reporting season.
Breadth remains the main concern
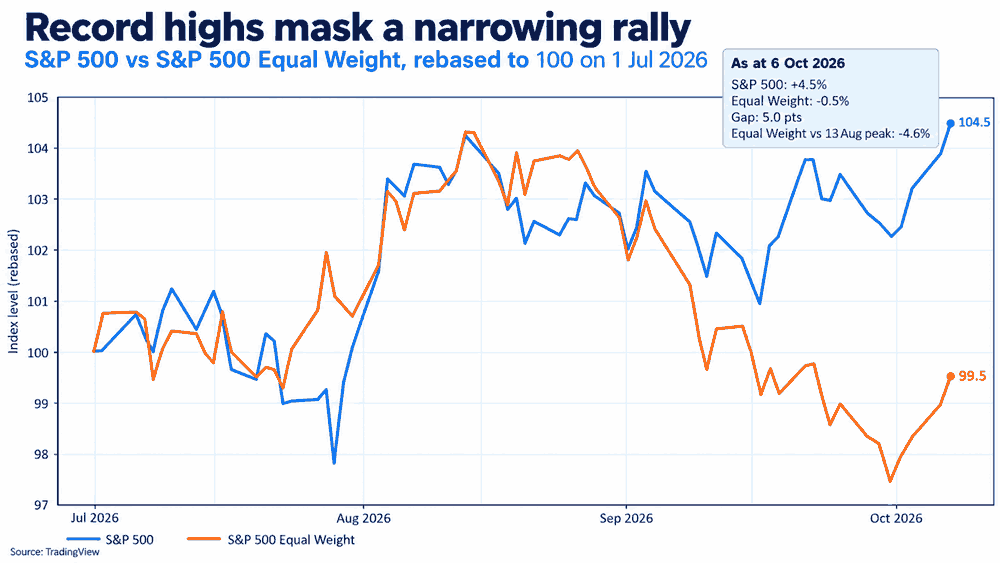
While technicals and seasonality point to the potential for an extension of the breakout, one key deterrent being debated right now is how narrow the breadth of the rally has been, concentrating in the AI-related giants which were responsible for the lion’s share of the aggregate revenue and earnings beats earlier this year.
Source: TradingView
That concern is reflected in the performance of the S&P 500 Equal Weight Index. While the headline S&P 500 has pushed to fresh record highs, the equal-weight index remains around 4.6% below the peak set on August 13. Since the beginning of July, the cap-weighted index has gained around 4.5%, compared with a small decline for its equal-weight counterpart.
Market breadth data tells a similar story. As of October 6, just 29.5% of S&P 500 constituents were trading above their 50-day moving average, down almost 13 percentage points over the previous 20 sessions. Only 46.8% were above their 200-day moving average, down nearly 14 points over the same period.
There has been some improvement over shorter windows, with 43.4% of constituents now above their 20-day moving average, up around 17 percentage points over 20 sessions. So short-term participation has broadened to some degree, even if the medium and long-term picture remains considerably weaker.
While the detail suggests there are grounds to be cautious about chasing at record highs, history suggests it should not automatically be treated as a signal to fade the breakout either.
Looking back through the available data, periods when the S&P 500 made a fresh 20-session high without the percentage of constituents trading above their 200-day moving average also reaching a 20-session high were generally followed by softer returns than usual, rather than outright declines.
Twenty sessions after those breadth divergences, the S&P 500 was still higher around 72% of the time, with a median gain of roughly 1.5%. Put bluntly, while narrowing breadth may challenge the pace of further upside, it does not necessarily mean a reversal is imminent either.
Latest market news




Open an account in minutes
Experience award-winning platforms with fast and secure execution, and enjoy tight spreads from 0.5 pts on FX and 0.3 pts on indices.
Economic calendar
Web Trader platform
Our sophisticated web-based platform is packed with features.
Related articles
S&P 500 breakout puts 8,000 in sight
Fresh record highs, supportive seasonality and earnings season just ahead leave the S&P 500 bulls with plenty in their favour, even as narrowing breadth argues against getting too carried away.
NZD/USD reversal case strengthens as Fed pricing cools
NZD/USD has triggered a bullish reversal after a punishing two-month decline, with less hawkish Fed pricing and an aggressive RBNZ rates path providing fuel for a rebound.

US Dollar Technical Forecast: DXY 4% Rally Stalls at Pivotal Resistance 10 6 2026
DXY is pressing a major inflection zone as stretched momentum and shifting Fed expectations raise the stakes for the next move.

This report is intended for general circulation only. It should not be construed as a recommendation, or an offer (or solicitation of an offer) to buy or sell any financial products. The information provided does not take into account your specific investment objectives, financial situation or particular needs. Before you act on any recommendation that may be contained in this report, independent advice ought to be sought from a financial adviser regarding the suitability of the investment product, taking into account your specific investment objectives, financial situation or particular needs.
StoneX Financial Pte. Ltd., may distribute reports produced by its respective foreign entities or affiliates within the StoneX group of companies or third parties pursuant to an arrangement under Regulation 32C of the Financial Advisers Regulations. Where the report is distributed to a person in Singapore who is not an accredited investor, expert investor or an institutional investor (as defined in the Securities Futures Act), StoneX Financial Pte. Ltd. accepts legal responsibility to such persons for the contents of the report only to the extent required by law. Singapore recipients should contact StoneX Financial Pte. Ltd. at 6826 9988 for matters arising from, or in connection with the report.
In the case of all other recipients of this report, to the extent permitted by applicable laws and regulations neither StoneX Financial Pte. Ltd. nor its associated companies will be responsible or liable for any loss or damage incurred arising out of, or in connection with, any use of the information contained in this report and all such liability is hereby expressly disclaimed. No representation or warranty is made, express or implied, that the content of this report is complete or accurate.
StoneX Financial Pte. Ltd. is not under any obligation to update this report.
Trading CFDs carries a high level of risk that may not be suitable for some investors. Consider your investment objectives, level of experience, financial resources, risk appetite and other relevant circumstances carefully. The possibility exists that you could lose some or all of your investments, including your initial deposits. If in doubt, please seek independent expert advice. Visit www.forex.com/en-sg/terms-and-policies for the complete Risk Disclosure Statement.