



USD/CAD, EUR/CAD Outlook: Canadian Dollar Bulls Flex Ahead Inflation
Canadian dollar rallies ahead of CPI as stronger manufacturing contrasts with weak employment, with USD/CAD and EUR/CAD testing key resistance levels.
Share this:

The Canadian dollar is flexing its muscles ahead of this week’s inflation report, supported by stronger manufacturing sales and early signs of a technical reversal across CAD pairs. While soft employment data raises pressure on the Bank of Canada to cut rates, the broader picture suggests CAD bulls may not be done yet.
View related analysis:
View related analysis:
Canadian Employment Weakness Fuels BoC Rate Cut Bets
The Bank of Canada is expected to cut its overnight cash rate (OCR) by 25bp to 2.5% on Wednesday, a move that the 1-month OIS has priced in with a 64% probability.
Weakening labour market conditions are the main reason the BoC may be forced to resume its easing cycle, with employment contracting, participation declining, and unemployment climbing.
Employment fell for a second straight month in August, with the -65.5k drop marking the sharpest decline since January 2022. While the bulk of the losses came from part-time jobs (-59.7k), the deterioration is still significant. The participation rate slid to 65.1%, its lowest since May 2021, while the unemployment rate climbed to 7.1% – the highest since August 2021.
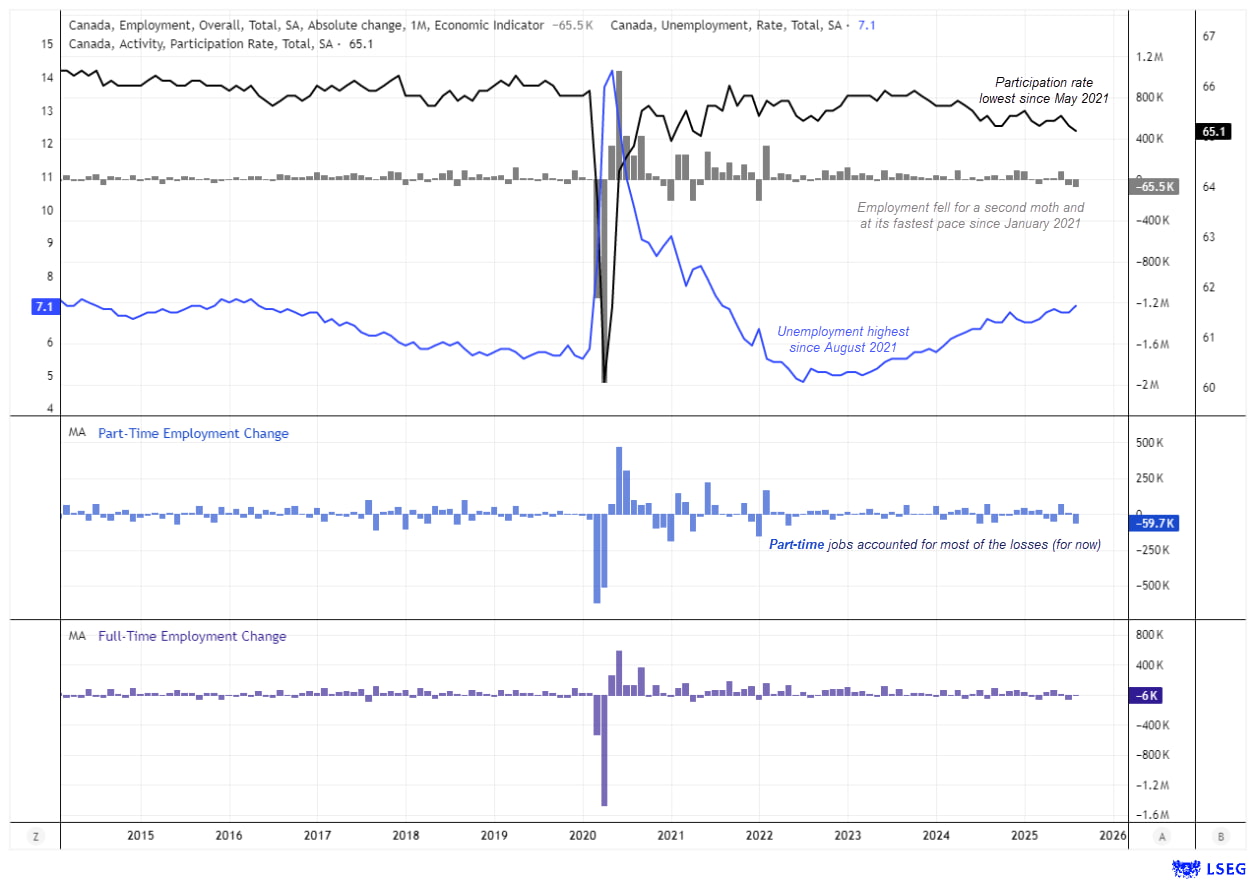
Chart analysis by Matt Simpon, data source: Statistics Canada, LSEG
Canadian Manufacturing Rebound Eases Pressure on BoC
With the 1-year OIS only pricing a 54% chance of another 25bp cut, market expectations are not overly dovish. The BoC could adopt a more cautious tone with this week’s rate cut, particularly after the surprise rebound in manufacturing sales.
Manufacturing sales rose 2.5% in July to $70.3 billion, the fastest pace since January 2023. The transportation sector led the gains, with auto and aerospace sales rebounding strongly. Normally, July sees temporary shutdowns in Ontario auto plants, but closures were less severe this year. Combined with a 6.7% rise in auto exports, the data suggests manufacturers are adapting to Trump’s tariffs, signalling that the worst disruptions may have passed.
If stronger inflation figures follow, money markets could fully price out expectations of further rate cuts, potentially boosting the Canadian dollar broadly.
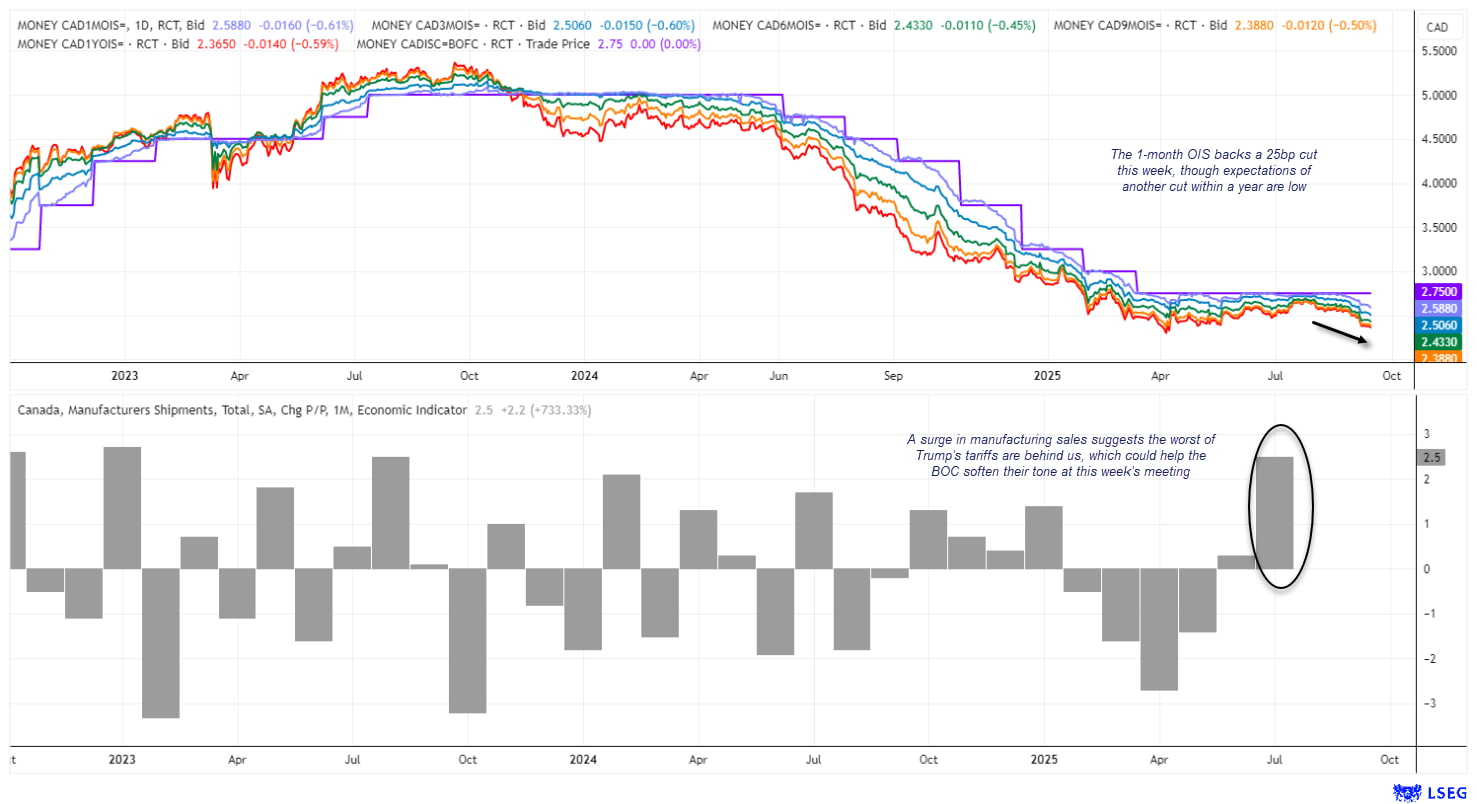
Chart analysis by Matt Simpon, data source: Statistics Canada, LSEG


Canadian Inflation Data Key for BoC and Loonie Direction
Attention now shifts to today’s inflation report. Headline CPI has slowed to 1.7% y/y, but core CPI remains at 2.6%, the upper end of the BoC’s target band. Meanwhile, trimmed mean inflation at 3.0% and median CPI at 3.1% remain uncomfortably high for doves.
Counterintuitively, the Canadian dollar could weaken if trimmed mean and median CPI linger deeper into the 3% range, as that would raise stagflation concerns and revive expectations for further BoC cuts. Conversely, even a modest cooling in these measures could give the BoC breathing space to be more cautious with its dovish messaging, potentially lifting the Canadian dollar.
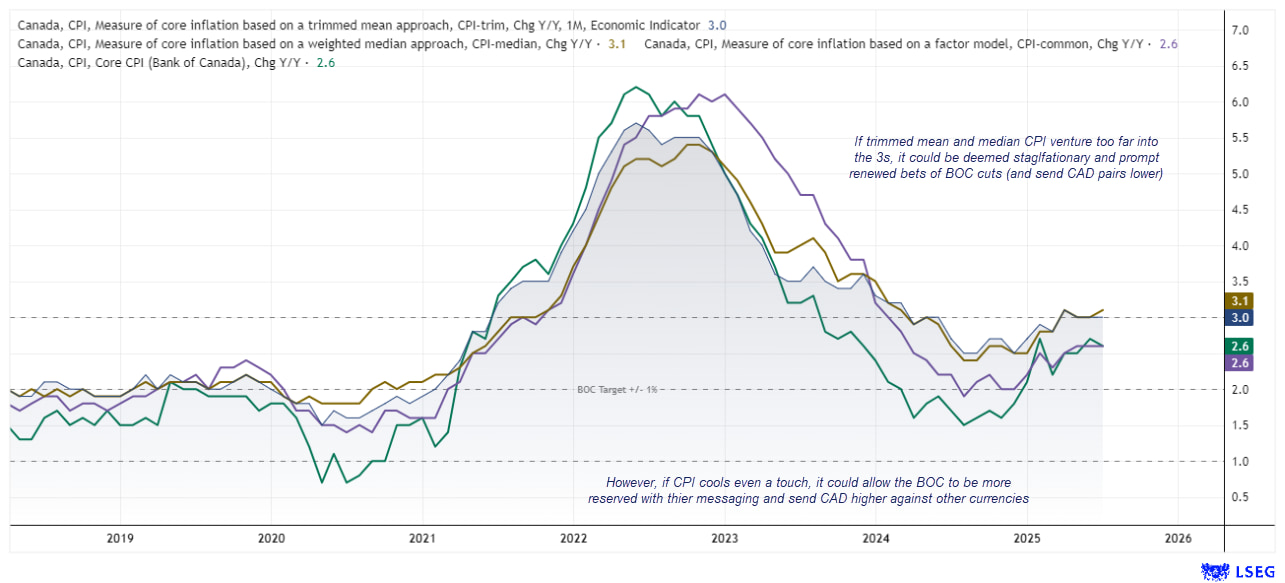
Chart analysis by Matt Simpon, data source: Statistics Canada, LSEG
Canadian Dollar Technical Analysis
We’re seeing early signs of a reversal in favour of Canadian dollar bulls, and I expect these moves to extend. It’s still early days, but CAD is trading higher against all its major FX peers so far this week, building on mixed success against them late last week.
GBP/CAD formed a notable bearish engulfing candle around the June high on Monday, snapping its 7-day rally. A similar bearish engulfing pattern appeared on EUR/CAD, hinting at a near-term cycle high. The mighty Australian dollar has also allowed AUD/CAD to retrace for a third straight day from its highest level since November 2023. CAD/JPY has risen for a third day as well, though my bias remains neutral for now. USD/CAD, however, has caught my attention, as it appears to have finally printed the swing high I anticipated last week.


USD/CAD Weekly Chart Signals Swing High, Eyes 1.3585 Support
About a month ago, I outlined my bias for USD/CAD to edge slightly higher before printing a swing high and reversing lower. It now looks like that swing high has formed on the weekly chart, with USD/CAD poised to move lower as Canadian dollar bulls gain momentum.
The weekly chart shows two false breaks of the July high: first with a shooting star candle, then with a spinning top doji. The doji marked a lower high relative to the shooting star, while a small bearish divergence appeared on the weekly RSI (2) beforehand. The 50-week EMA continues to cap as resistance, while the weekly RSI (14) is curling lower and remains below the 50 level.
I suspect USD/CAD will next target the high-volume node (HVN) and 200-week EMA, near 1.3585.
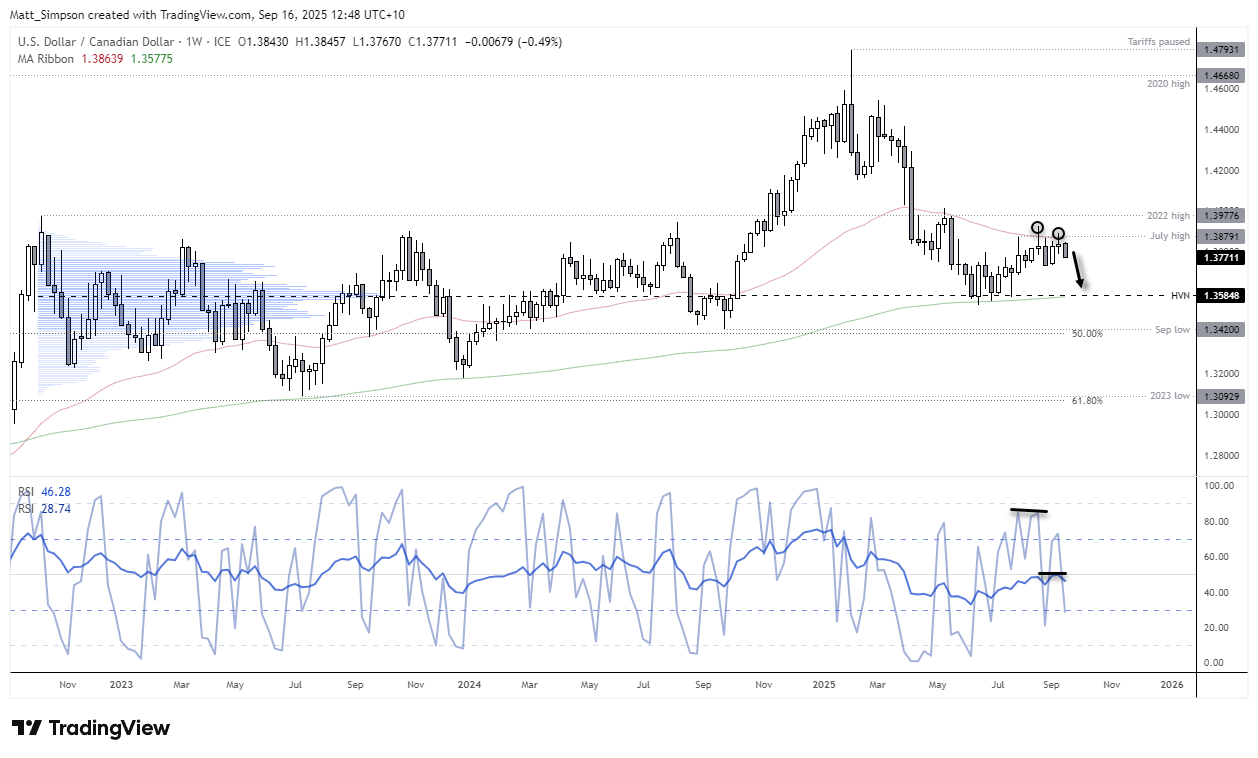
Chart analysis by Matt Simpson - data source: TradingView USD/CAD
EUR/CAD Bearish Divergence Points to Near-Term Pullback
The euro has risen over 26% from its 2022 low to recent highs, driving EUR/CAD to a 16-year peak. I doubt the broader move has run its course, though like GBP/CAD, I see scope for bearish mean reversion in the near term.
The daily chart shows a well-established uptrend, but price action looks overstretched from the 50-day EMA. A bearish divergence has also formed on the daily RSI (2), with the rally stalling around the monthly R1 pivot. Monday’s bearish engulfing candle suggests a minor top may now be in place.
For now, I’m simply seeking mean reversion while prices hold beneath Monday’s high. The weekly VPOC around 1.60, aligned with the 50-day EMA (1.0656) and monthly pivot point, offers a potential bearish target in the near term.

Chart analysis by Matt Simpson - data source: TradingView EUR/CAD
View the full economic calendar
View the full economic calendar
-- Written by Matt Simpson
Follow Matt on Twitter @cLeverEdge
How to trade with City Index
You can trade with City Index by following these four easy steps:
- Open an account, or log in if you’re already a customer
• Open an account in the UK
• Open an account in Australia
• Open an account in Singapore
- Search for the market you want to trade in our award-winning platform
- Choose your position and size, and your stop and limit levels
- Place the trade



Open an account in minutes
Experience award-winning platforms with fast and secure execution, and enjoy tight spreads from 0.5 pts on FX and 0.3 pts on indices.
Economic calendar
Web Trader platform
Our sophisticated web-based platform is packed with features.
Related articles

USD/JPY Forecast: Is Rising Japanese Inflation Supporting the Yen?
As the trading week comes to an end, one of the most relevant developments in the FX market has been the renewed strength of the Japanese yen. This can be seen in the recent performance of USD/JPY, which has fallen nearly 1.0% over the last two trading sessions, highlighting a meaningful recovery in the Japanese currency against the U.S. dollar.


US Dollar Price Action Setups: EUR/USD, USD/JPY, GBP/USD, USD/CAD
The Dollar is working on its second consecutive red week and while sellers didn’t exactly pounce on fresh lows, there’s an opening door for bears to make a move.


Silver forecast: metals liquidation drags XAG/USD into $50-55 support
Silver has broken its July low and slipped into a long-term support zone as the selling in precious metals deepens. The chart shows where the metal could bottom, and next week's Fed decision may decide whether it does.

This report is intended for general circulation only. It should not be construed as a recommendation, or an offer (or solicitation of an offer) to buy or sell any financial products. The information provided does not take into account your specific investment objectives, financial situation or particular needs. Before you act on any recommendation that may be contained in this report, independent advice ought to be sought from a financial adviser regarding the suitability of the investment product, taking into account your specific investment objectives, financial situation or particular needs.
StoneX Financial Pte. Ltd., may distribute reports produced by its respective foreign entities or affiliates within the StoneX group of companies or third parties pursuant to an arrangement under Regulation 32C of the Financial Advisers Regulations. Where the report is distributed to a person in Singapore who is not an accredited investor, expert investor or an institutional investor (as defined in the Securities Futures Act), StoneX Financial Pte. Ltd. accepts legal responsibility to such persons for the contents of the report only to the extent required by law. Singapore recipients should contact StoneX Financial Pte. Ltd. at 6826 9988 for matters arising from, or in connection with the report.
In the case of all other recipients of this report, to the extent permitted by applicable laws and regulations neither StoneX Financial Pte. Ltd. nor its associated companies will be responsible or liable for any loss or damage incurred arising out of, or in connection with, any use of the information contained in this report and all such liability is hereby expressly disclaimed. No representation or warranty is made, express or implied, that the content of this report is complete or accurate.
StoneX Financial Pte. Ltd. is not under any obligation to update this report.
Trading CFDs carries a high level of risk that may not be suitable for some investors. Consider your investment objectives, level of experience, financial resources, risk appetite and other relevant circumstances carefully. The possibility exists that you could lose some or all of your investments, including your initial deposits. If in doubt, please seek independent expert advice. Visit www.forex.com/en-sg/terms-and-policies for the complete Risk Disclosure Statement.