






USD/JPY, Nikkei pause at resistance as US CPI, FOMC looms: Asian Open
The next 24 hours will be the eight time in 10 years that a US CPI report lands on the same day as an FOMC meeting, and it has traders on tenterhooks. Today we look at USD/JPY, Nikkei 225 and the ASX 200.
Share this:

The US dollar extended its gains for a third day, although bullish volatility is clearly receding. So whilst EUR/USD edged closer to 1.07 its next directional move is in the hands of US CPI and the Fed over the next 24 hours.
This is only the 15th time since 2014 that the two events have landed on the same day, and the inflation report could easily sway the tone of the meeting less than six hours later. Whilst the Fed are fully expected to keep policy unchanged, we’re all looking for how they shape expectation from September through to 2025. Given strong employment figures, I suspect the Fed’s hands are tied and they may not feel the urge to provide a dovish tone – especially if CPI comes in hot.
Gold posted a marginal gain in line with yesterday’s bias, although I had hoped for a little more follow through. Still, if inflation behaves and the Fed shape expectations for easing laser this year then the USD could tumble and send gold prices surging higher alongside Wall Street indices.
Apple shares (AAPL) surged 7% to a record high after the company announced new AI features on Monday, helping tech shares lead the way higher for Wall Street. The S&P 500 and Nasdaq closed at a record high ahead of the highly anticipated US CPI and FOMC report.
Hang Seng futures were lower for a third day yet continue to hold above the 50% retracement level and 18k handle – making it a pivotal area over the near-term. Nikkei 225 futures were closed back below 39k on Tuesday and formed a bearish inside day. The market needs to push above the May high of 39,460 to invalidate the bearish bias outlined recently.
Economic events (times in AEST)
- 08:45 – New Zealand migration and visitors
- 09:50 – Japan’s PPI
- 11:30 – China CPI, PPI
- 16:00 – UK monthly GDP, industrial/manufacturing/construction output, trade balance
- 16:00 – Germany CPI
- 19:30 – ECB Schnabel Speaks, Supervisory Board Member Tuominen Speaks
- 22:30 – US CPI
- 04:00 – Fed interest rate decision, staff forecasts, dot plot and statement
- 04:30 – FOMC press conference
USD/JPY technical analysis:
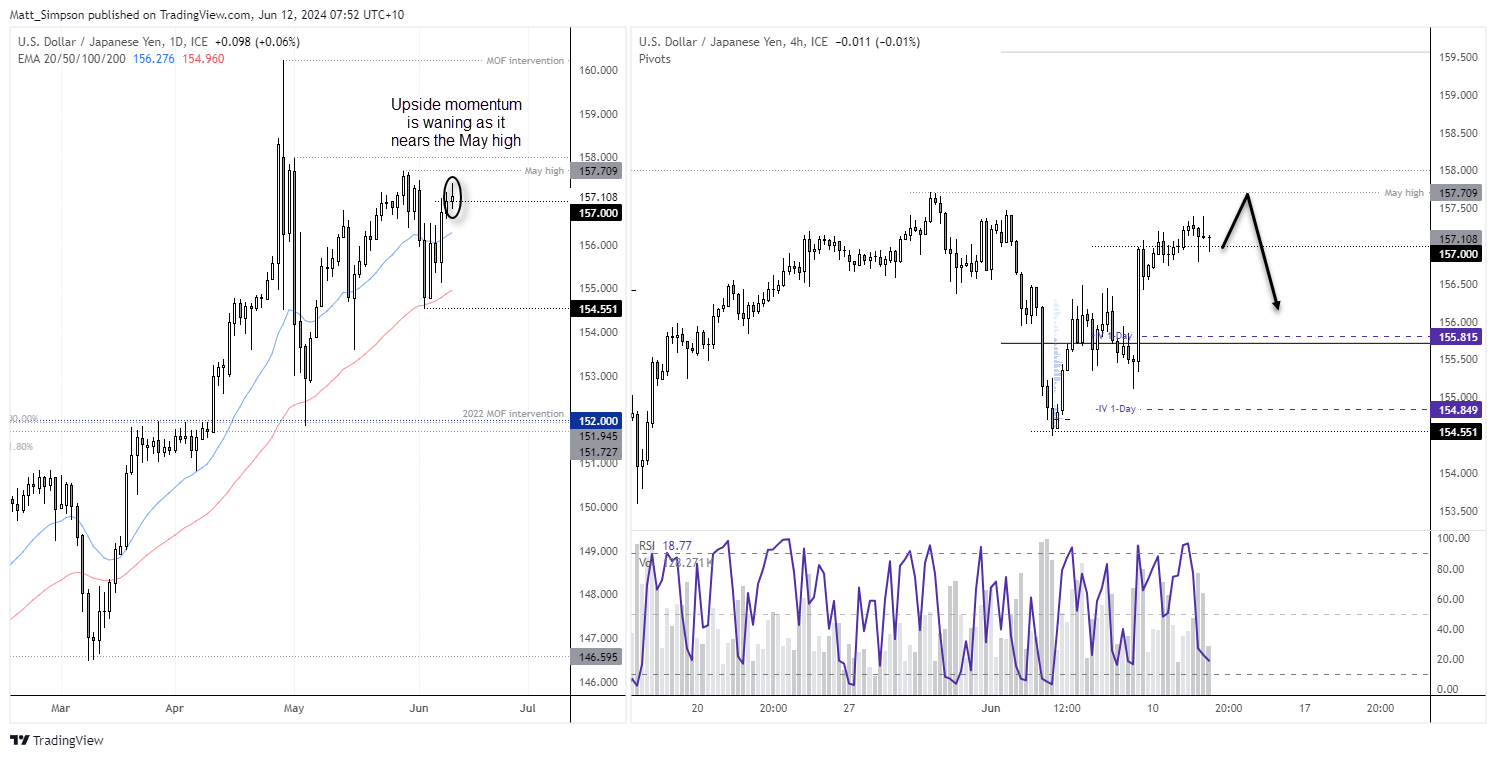
Like the US dollar index, upside volatility for USD/JPY is waning as it nears the May high. Prices are meandering around the 157 handle, a level which could spur a few cheeky long bets in today’s session. But with the 4-hour RSI (2) approaching oversold, I suspect dips might be bought and USD/JPY ha another crack at the May high – even if it might not reach it. Should prices rise, I suspect a reasonable chance that bears could seek to fade into moves towards the May high with a stop above 158 ahead of US CPI.
Nikkei 225 futures technical analysis:
My bearish bias for the Nikkei 225 to fall to 37k or 35k was close to becoming invalidated with a break above the May high (39,460). However, a bearish inside day formed on Tuesday to keep it alive ahead of a huge risk event, even if only just. And it really is down to whether CPI is soft and the Fed deliver a dovish tone as to whether the Nikkei surges higher alongside global stocks, or roll over if the Fed disappoints and stops short of any dovish tone.
For now, I see the potential for at least a minor leg higher today. The 1-hour chart shows a bullish (even if choppy) trend, and a small bullish candle just snaped a 3-bar bearish streak after RSI (2) reached oversold. Prices are also holding above a high-volume node at 38,750.
I’m not looking for any home runs today, but the Nikkei might get a boost from the Nasdaq reaching a record high, so perhaps a move to 39,200 is achievable. Beyond that, it all comes down to how risk events play out over the next 24 hours as to where the Nikkei goes next.
ASX 200 at a glance:
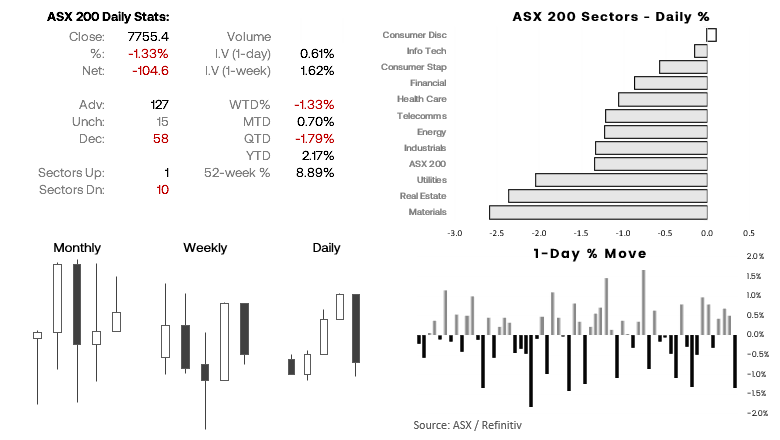
- The ASX cash market snapped a 3-day wining streak during its worst day in six months
- 10 of the 11 ASX 200 sectors declined, led by materials and real estate
- 1-day implied volatility rose to its highest level since late May of +/- 0.67%
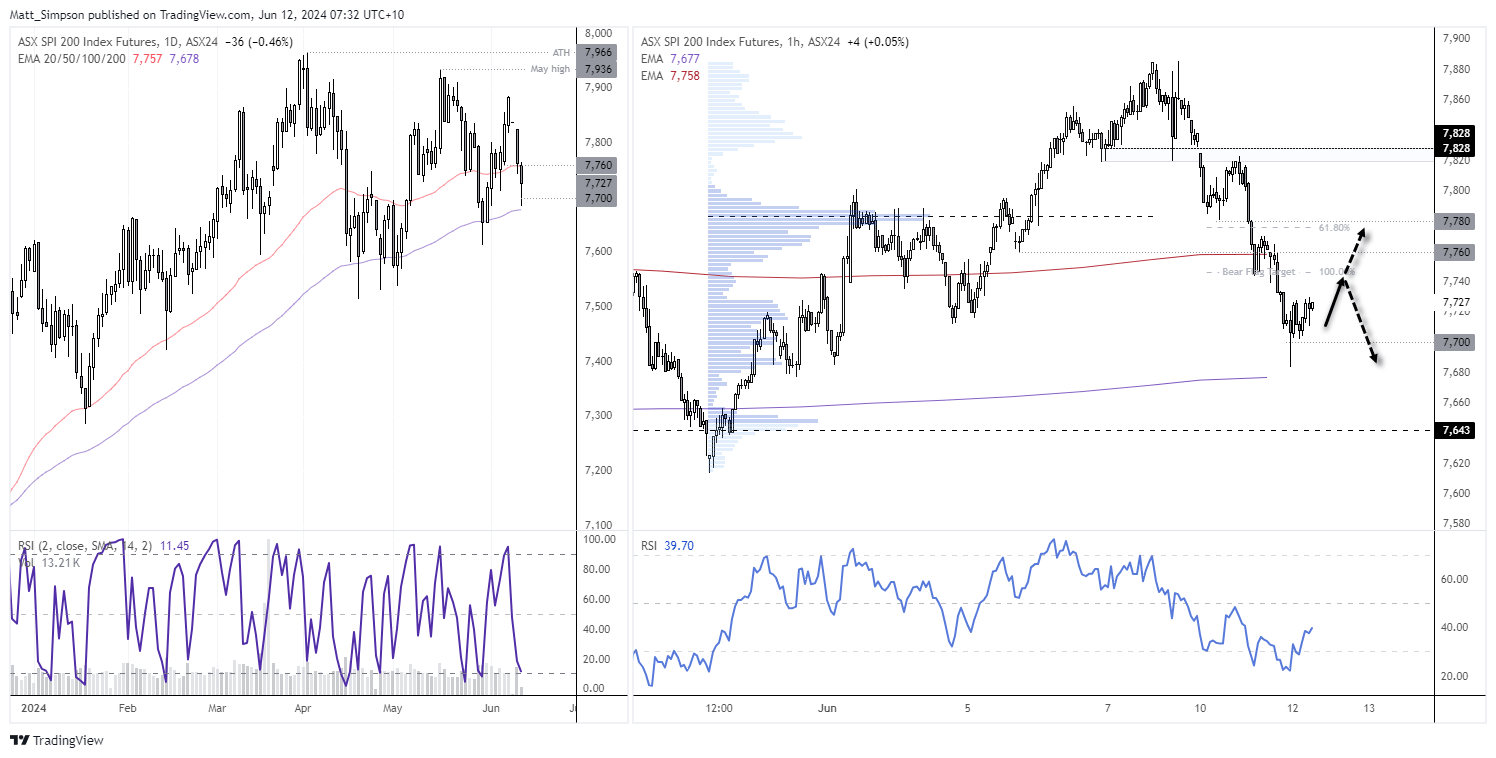
- SPI 200 futures reached the downside bear flag target outlined in yesterday’s report, and continued lower overnight
- Support was found just above the 100-day EMA and prices recovered back above 7700
- A bullish hammer on H4 marked to move above 700 with RSI oversold
- Today’s bias is for cautious gains while 7700 supports
View the full economic calendar
View the full economic calendar
-- Written by Matt Simpson
Follow Matt on Twitter @cLeverEdge
How to trade with City Index
You can trade with City Index by following these four easy steps:
- Open an account, or log in if you’re already a customer
• Open an account in the UK
• Open an account in Australia
• Open an account in Singapore
- Search for the market you want to trade in our award-winning platform
- Choose your position and size, and your stop and limit levels
- Place the trade
Related tags:

Open an account in minutes
Experience award-winning platforms with fast and secure execution, and enjoy tight spreads from 0.5 pts on FX and 0.3 pts on indices.
Economic calendar
Web Trader platform
Our sophisticated web-based platform is packed with features.
Related articles

USD/CAD shooting star puts September surge on notice
USD/CAD has printed a clear bearish reversal pattern after an extraordinary September surge, but confirmation may depend heavily on how US Treasury yields react to Friday’s payrolls report.


USD/CHF Reverses as Swiss Franc Surges amid Bond Carnage
USD/CHF reverses from channel resistance as bond volatility surges and broad Swiss franc strength points to a possible carry-trade unwind.

USD/MXN Analysis: Is Super Peso Starting to Fade?
Over recent trading sessions, the Mexican peso has continued to show signs of weakness against the U.S. dollar. This can already be seen in USD/MXN, which has gained more than 1.7% over the last three sessions, highlighting sustained buying pressure in favor of the dollar in the short term.

This report is intended for general circulation only. It should not be construed as a recommendation, or an offer (or solicitation of an offer) to buy or sell any financial products. The information provided does not take into account your specific investment objectives, financial situation or particular needs. Before you act on any recommendation that may be contained in this report, independent advice ought to be sought from a financial adviser regarding the suitability of the investment product, taking into account your specific investment objectives, financial situation or particular needs.
StoneX Financial Pte. Ltd., may distribute reports produced by its respective foreign entities or affiliates within the StoneX group of companies or third parties pursuant to an arrangement under Regulation 32C of the Financial Advisers Regulations. Where the report is distributed to a person in Singapore who is not an accredited investor, expert investor or an institutional investor (as defined in the Securities Futures Act), StoneX Financial Pte. Ltd. accepts legal responsibility to such persons for the contents of the report only to the extent required by law. Singapore recipients should contact StoneX Financial Pte. Ltd. at 6826 9988 for matters arising from, or in connection with the report.
In the case of all other recipients of this report, to the extent permitted by applicable laws and regulations neither StoneX Financial Pte. Ltd. nor its associated companies will be responsible or liable for any loss or damage incurred arising out of, or in connection with, any use of the information contained in this report and all such liability is hereby expressly disclaimed. No representation or warranty is made, express or implied, that the content of this report is complete or accurate.
StoneX Financial Pte. Ltd. is not under any obligation to update this report.
Trading CFDs carries a high level of risk that may not be suitable for some investors. Consider your investment objectives, level of experience, financial resources, risk appetite and other relevant circumstances carefully. The possibility exists that you could lose some or all of your investments, including your initial deposits. If in doubt, please seek independent expert advice. Visit www.forex.com/en-sg/terms-and-policies for the complete Risk Disclosure Statement.