



USD/JPY Rallies to Highs as USD Ascending Triangle Breaks
It’s been a strong start to the week for the US Dollar as the currency resolved an ascending triangle formation in a very bullish fashion. Leading the charge is USD/JPY setting a fresh monthly high but there’s now the challenge of bigger picture dynamics at play.
Share this:


On Friday the US Dollar was testing support in the ascending triangle formation but for the past month and change the currency had held up fairly well as the USD/JPY rally came back to life. As I covered in the Friday article and video, I still think that USD/JPY is a primary push point for the DXY basket which then carries impact into EUR/USD, GBP/USD and other USD pairs, but with the weekend events in Iran both the US Dollar and USD/JPY broke out in a big way to start the week.
Now we have the challenge of proximity to the 160.00 level in USD/JPY; a price that has already brought out threats of intervention from the Japanese Finance Ministry. Perhaps the comment that was most impactful came in late-January, just before the BoJ-fueled reversal in the pair, in which Finance Minister Katayama in Japan mentioned that she had spoken with US Treasury Secretary Scott Bessent, and they shared the opinion that a stronger spot rate in USD/JPY was something both would prefer not to see.
This makes sense as further Yen-weakness threatens higher inflation rates in Japan and, in-turn, higher bond yields which makes it more expensive for the government to borrow money. And for the US Dollar, President Trump has been quite vocal about his desire for a weaker Dollar on numerous occasions since his inauguration a year ago. With two of the world’s largest national central banks wanting the same thing, it seems a tough fight to bet on the other side of the argument and this is perhaps one of the major reasons that the pair put in a lower-high after the BoJ meeting in late January before falling by 800 pips in just a few days.
As I covered then, USD/JPY can still be attractive on the long side provided that price is further away from recent highs. But as we get closer to that 160.00 level the perceived risk-reward for upside plays gets less and less attractive, and this can lead to a run of selling similar to what showed both in late January and then again in February.
Now, we’re testing resistance at that same high that had stalled the move a few weeks ago and this is a difficult breakout to chase.
USD/JPY Daily Price Chart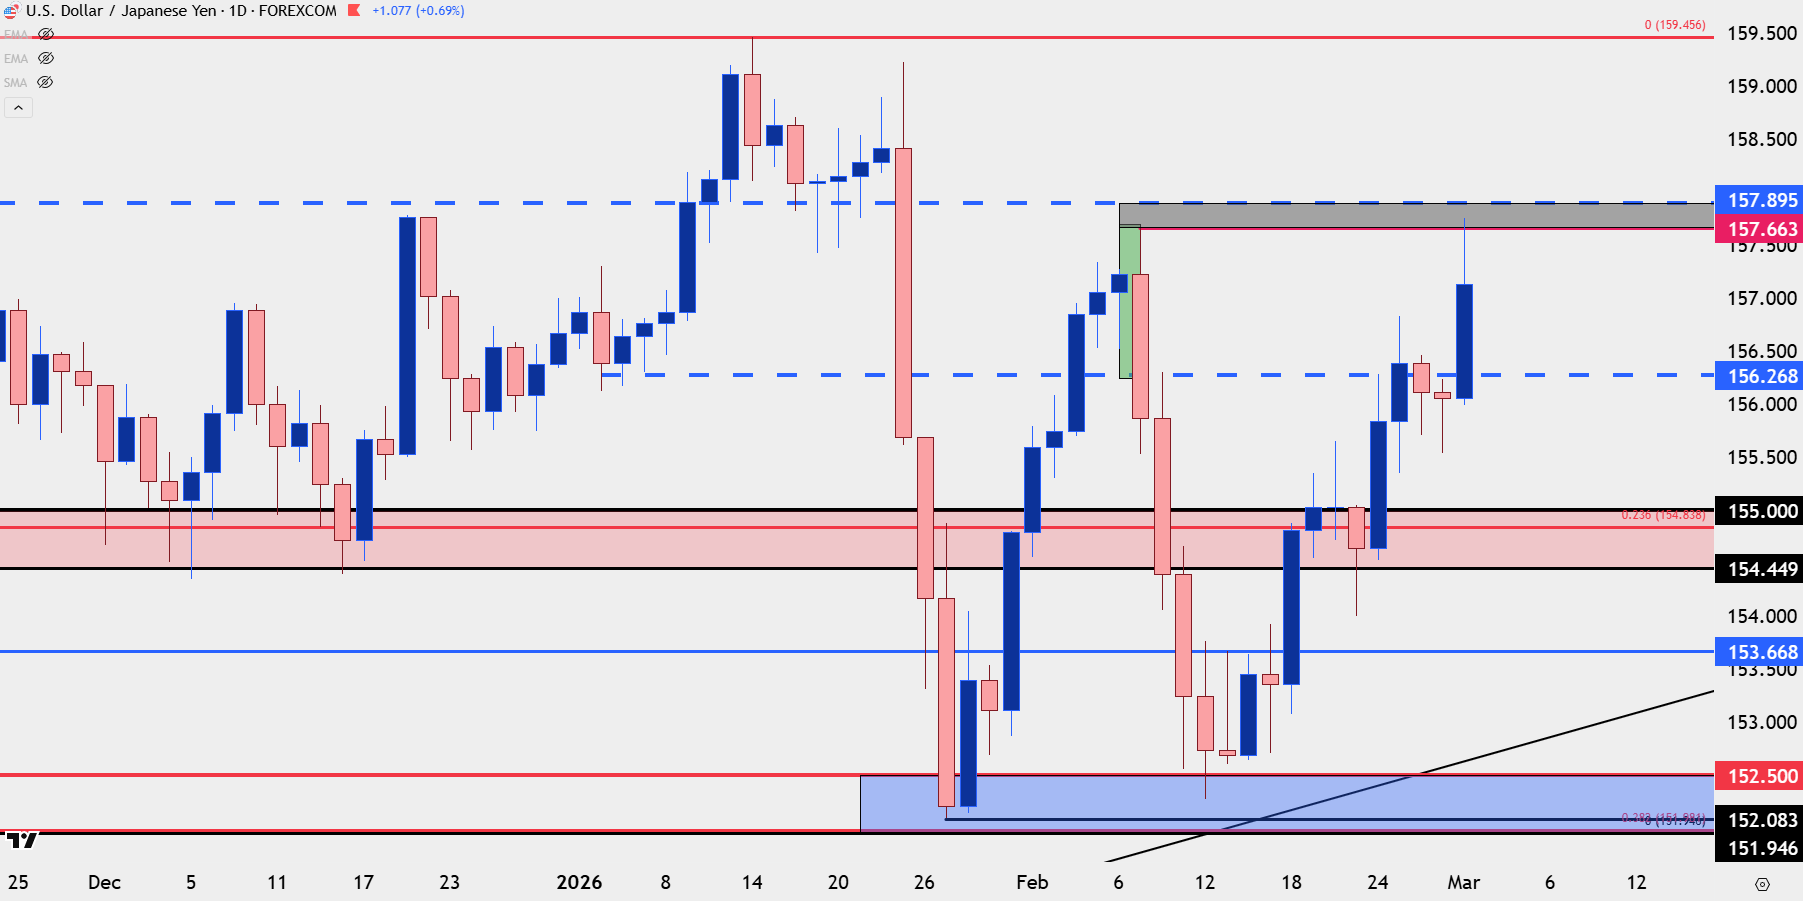
Chart prepared by James Stanley; data derived from Tradingview
US Dollar Dynamics
It’s still early so one should be careful not to read too much into it, but the breakdown in EUR/USD has negated a falling wedge formation and price has also pushed through a massive spot of confluent support. If this Euro weakness is to continue, then, arguably, there could be another bullish catalyst for the USD that doesn’t involve USD/JPY.
But, that really only applies if USD/JPY doesn’t show aggressive bearish conditions similar to what happened in late-January. That episode appears to have been a brief but violent episode of carry unwind, which effectively pushed USD-weakness against several major currencies, the Euro included.
I’ll cover this in greater depth in the webinar tomorrow and you’re welcome to join, the link below will allow for registration.
In the US Dollar, it’s prior resistance from the ascending triangle that is now support potential.
US Dollar Daily Price Chart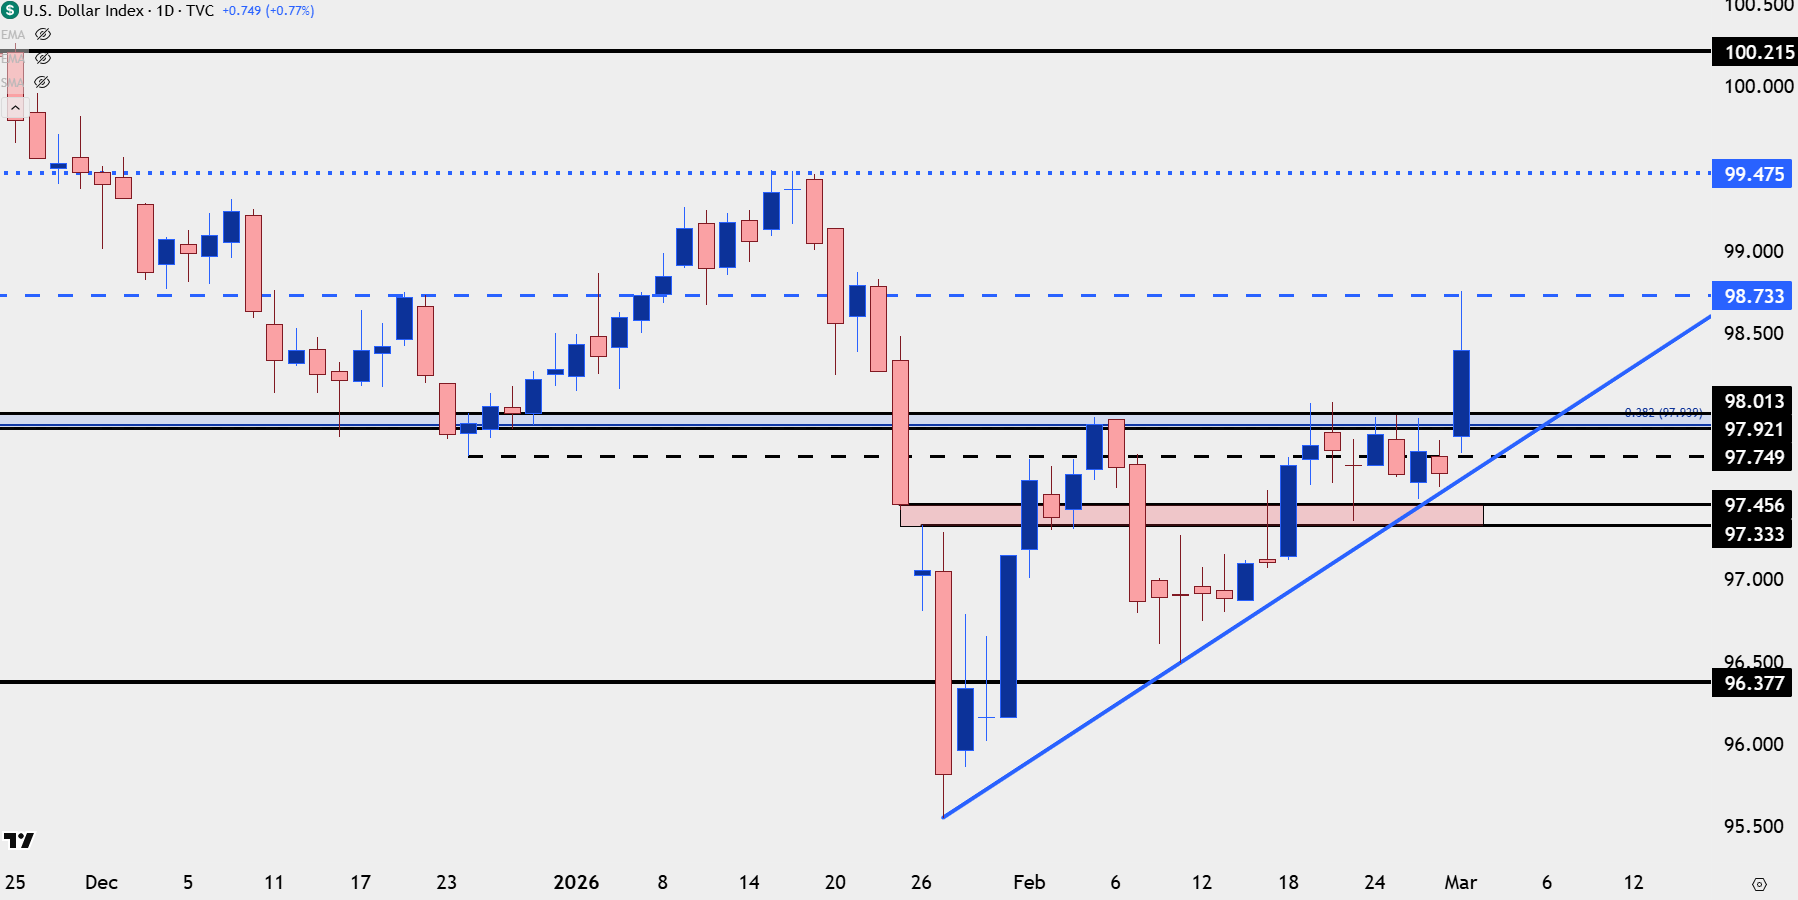
Chart prepared by James Stanley; data derived from Tradingview
USD/JPY Structure
While Chasing USD/JPY at highs or near this key resistance is unattractive, perhaps the better test for bulls is whether buyers show up at tests of potential support.
The 154.45-155.00 zone seems an obvious one as this has had multiple inflection points going back to October as both support and resistance. But, on a shorter-term basis, there’s the 156.27 level that was initially showing as resistance early last week, and that’s now a spot of possible support and if bulls remain aggressive, that could certainly function as the higher-low for the pair.
If 154.45 does not hold, however, it’s not necessarily ‘game over’ for buyers, as prior range resistance at 153.67 is of note, and then below that I’m considering invalidation from 151.95 up to 152.50. That’s the spot that has so far held two intense reactions after the late-January and then February sell-offs.
USD/JPY Four-Hour Price Chart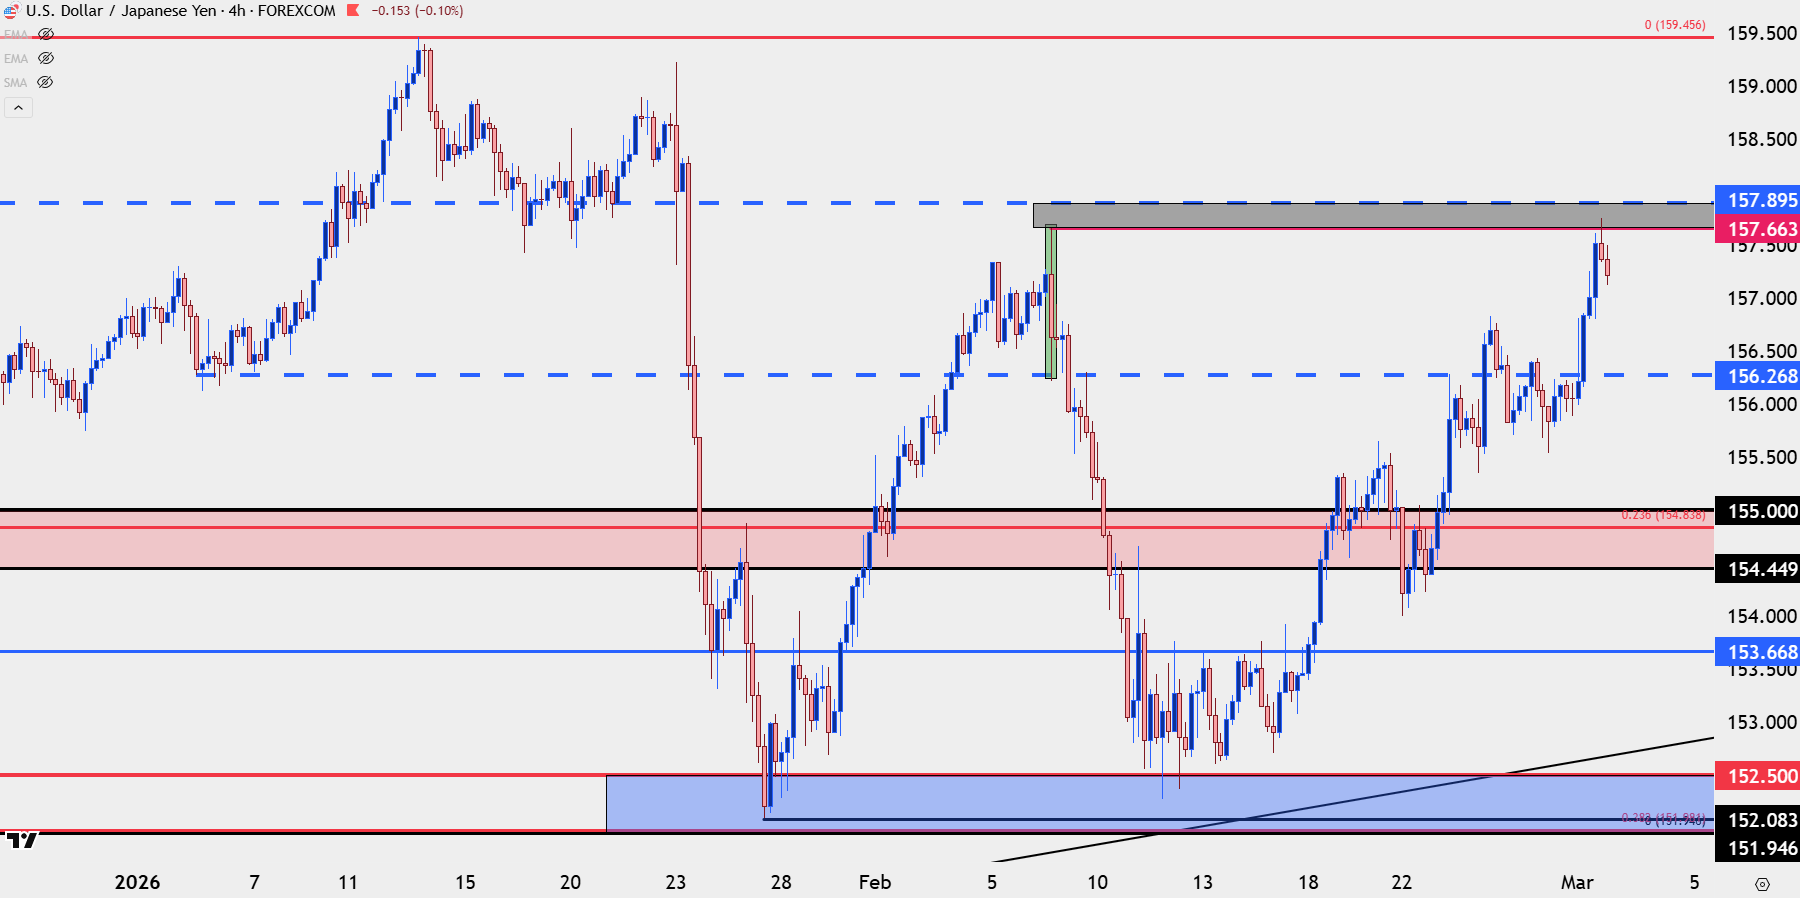
Chart prepared by James Stanley; data derived from Tradingview
--- written by James Stanley, Senior Market Analyst, Global Macro
Related tags:
Latest market news




Open an account in minutes
Experience award-winning platforms with fast and secure execution, and enjoy tight spreads from 0.5 pts on FX and 0.3 pts on indices.
Economic calendar
Web Trader platform
Our sophisticated web-based platform is packed with features.
Related articles
US Dollar Bears Lose Their Grip Ahead of NFP, USD/JPY Vols Elevated
US dollar selling pressure fades ahead of NFP as Fed hike bets retreat. USD/JPY stands out with a 141-pip implied move as FX volatility takes centre stage.
NFP Preview: New Government, Same Jobs Market?
Traders are still sifting through the fallout of the US midterm elections, just in time to get hit with another volatility: The monthly Non-Farm Payrolls (NFP) report - what will the jobs report show, and what could it mean for the US dollar?


US Dollar Technical Outlook: DXY Bulls Fight to Hold Critical Support Ahead of NFP 11 5 2026
DXY bulls are attempting to defend a pivotal technical threshold, with the next reaction likely to determine whether the broader recovery survives.

This report is intended for general circulation only. It should not be construed as a recommendation, or an offer (or solicitation of an offer) to buy or sell any financial products. The information provided does not take into account your specific investment objectives, financial situation or particular needs. Before you act on any recommendation that may be contained in this report, independent advice ought to be sought from a financial adviser regarding the suitability of the investment product, taking into account your specific investment objectives, financial situation or particular needs.
StoneX Financial Pte. Ltd., may distribute reports produced by its respective foreign entities or affiliates within the StoneX group of companies or third parties pursuant to an arrangement under Regulation 32C of the Financial Advisers Regulations. Where the report is distributed to a person in Singapore who is not an accredited investor, expert investor or an institutional investor (as defined in the Securities Futures Act), StoneX Financial Pte. Ltd. accepts legal responsibility to such persons for the contents of the report only to the extent required by law. Singapore recipients should contact StoneX Financial Pte. Ltd. at 6826 9988 for matters arising from, or in connection with the report.
In the case of all other recipients of this report, to the extent permitted by applicable laws and regulations neither StoneX Financial Pte. Ltd. nor its associated companies will be responsible or liable for any loss or damage incurred arising out of, or in connection with, any use of the information contained in this report and all such liability is hereby expressly disclaimed. No representation or warranty is made, express or implied, that the content of this report is complete or accurate.
StoneX Financial Pte. Ltd. is not under any obligation to update this report.
Trading CFDs carries a high level of risk that may not be suitable for some investors. Consider your investment objectives, level of experience, financial resources, risk appetite and other relevant circumstances carefully. The possibility exists that you could lose some or all of your investments, including your initial deposits. If in doubt, please seek independent expert advice. Visit www.forex.com/en-sg/terms-and-policies for the complete Risk Disclosure Statement.