

With the US Dollar at a key spot of resistance for more than a week now the backdrop in USD/JPY remains important to broader macro themes across the FX market. If the DXY is going to break out, it’s likely going to need some help from USD/JPY and the challenge there is proximity to a massive spot on the chart that bulls historically haven’t had a great time with.
Initially it was the 150.00 level in USD/JPY that was defended back in 2022 and really, it was the 145.00 level that was in-place ahead of that. When bulls ventured the break above 145.00 the Finance Ministry was driven into action, ordering the BoJ to intervene after one single daily close above the 150.00 handle. And that didn’t quite bring on reversal but it did stall bulls long enough for a below-expected CPI report to trigger a case of carry unwind in November of 2022, erasing 50% of the move that had taken 21 months to build in three short but violent months in the pair.
The same high was in-play a year later but in 2024, amidst a backdrop of strong US data, bulls finally mustered the motivation to push above the 151.95 level and drove up to 160.00, where our current saga extends.
The first touch of 160.00 brought another intervention order but that didn’t really work – bulls simply loaded up at 151.95 (the same prior resistance) and drove back up to the big figure. But the second intervention defense of 160.00 worked and it perhaps worked a bit too well, as below-expected CPI report coupled that to create a spiraling case of carry unwind. A lot of the levered trades that came out of that carry trade unwound as well and it didn’t take long for the headlines to point the finger at Japan as the reason for the global sell-off. VIX had it’s third-highest ever spike around that event, on the morning of August 5th, and at that point the Bank of Japan moved into a familiar cautious state as the pair finally found support at the 140.00 handle.
Since then – bulls haven’t wanted to re-test 160.00 over multiple tests and that’s the line in the sand from last year that remains the elusive spot for buyers.
USD/JPY Weekly Price Chart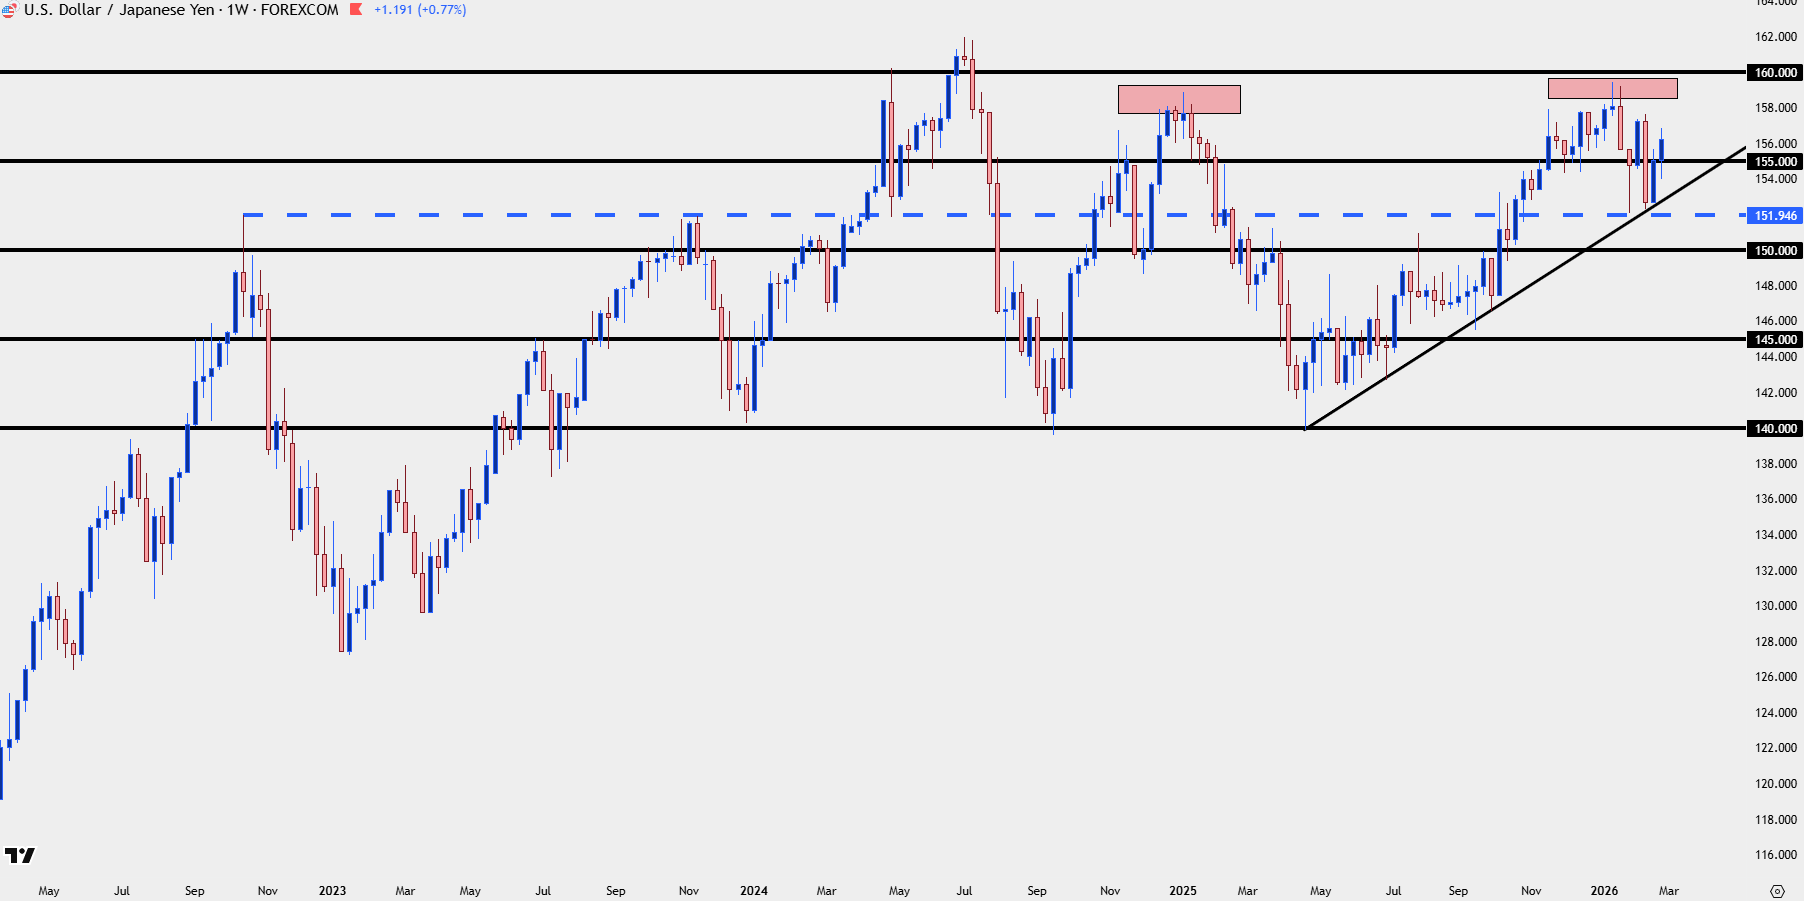
Chart prepared by James Stanley; data derived from Tradingview
USD/JPY
The principal challenge with USD/JPY at the moment is proximity to that resistance that has so far been hard to break. And with USD also at resistance, it seems an inopportune time to chase both themes at the same time. Pullbacks, however, can remain a constructive way to move forward on USD/JPY and the same 154.45-155.00 zone is of interest for that as it’s been in the picture since October as resistance and then December as support. More recently this helped to hold the pullback on Monday so there’s scope now for a higher-low to develop in this zone.
USD/JPY Daily Chart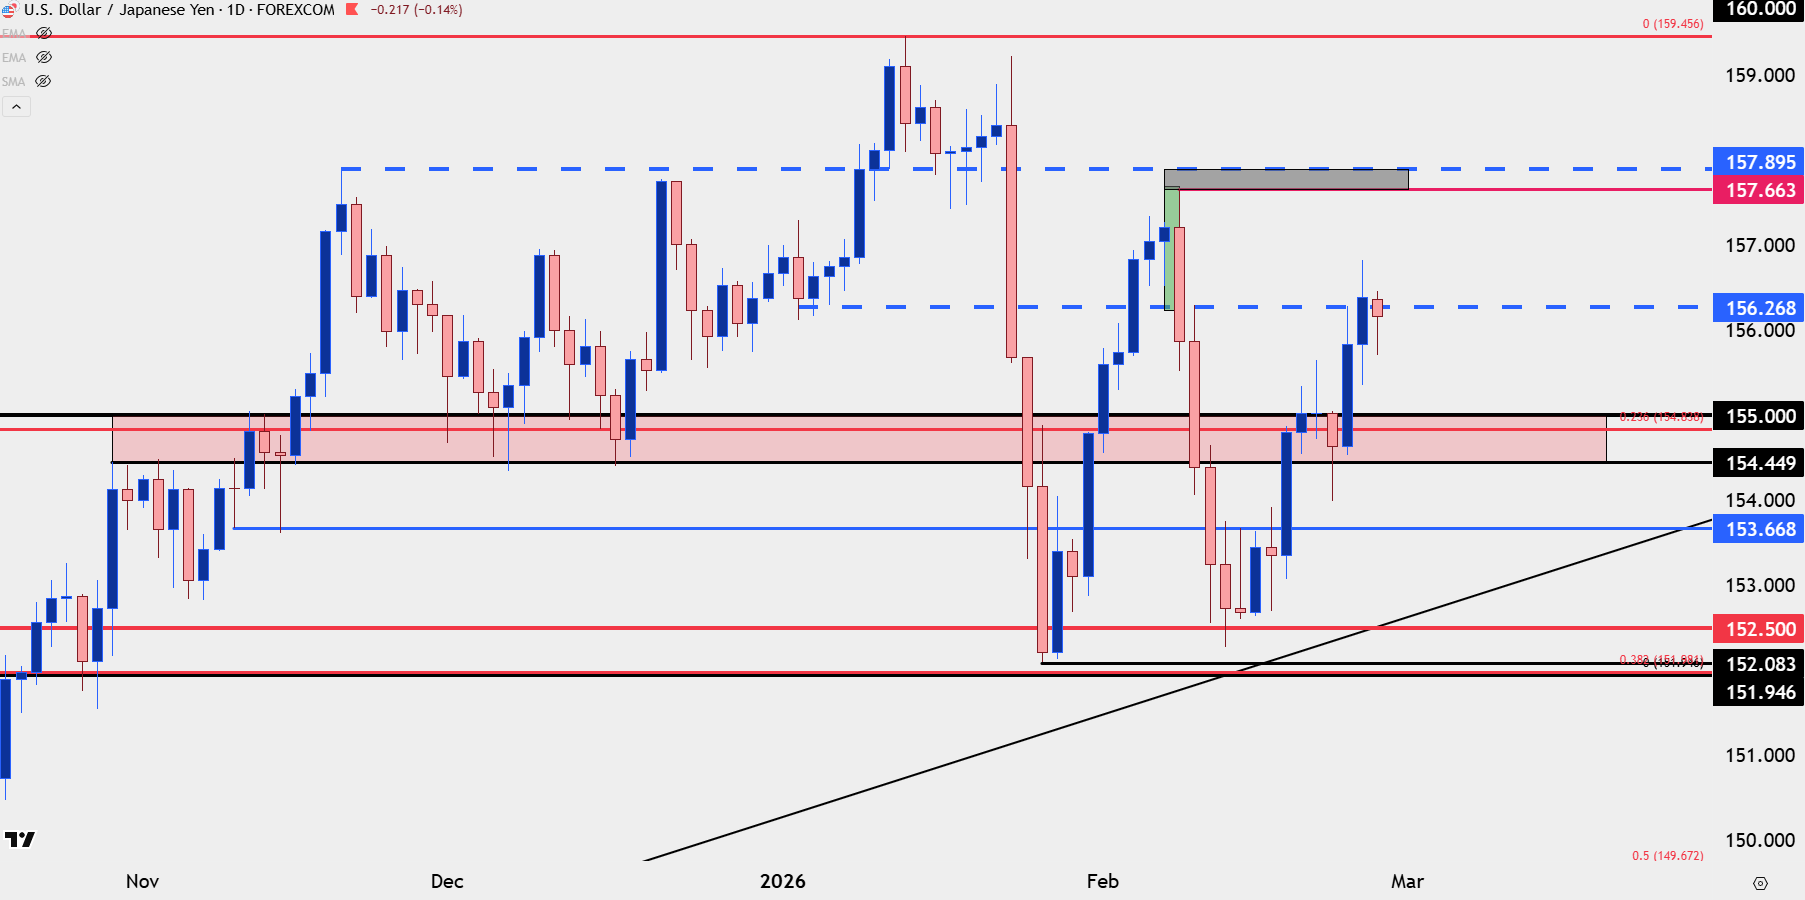
Chart prepared by James Stanley; data derived from Tradingview
EUR/JPY
One way to work with that Yen-weakness potential without taking on exposure in USD while DXY is at resistance is to veer over to cross pairs such as EUR/JPY. There’s been a similar come back over the past week in EUR/JPY and the four hour chart below illustrates bullish structure with some familiar levels at play. The 183.80 level is currently what I’m looking at as ‘s1’ support, with a zone from 182.65-183.16 as ‘s2.’ For ‘s3,’ it’s the area where the bottom built a couple of weeks ago at 180.81-181.20.
EUR/JPY Four-Hour Chart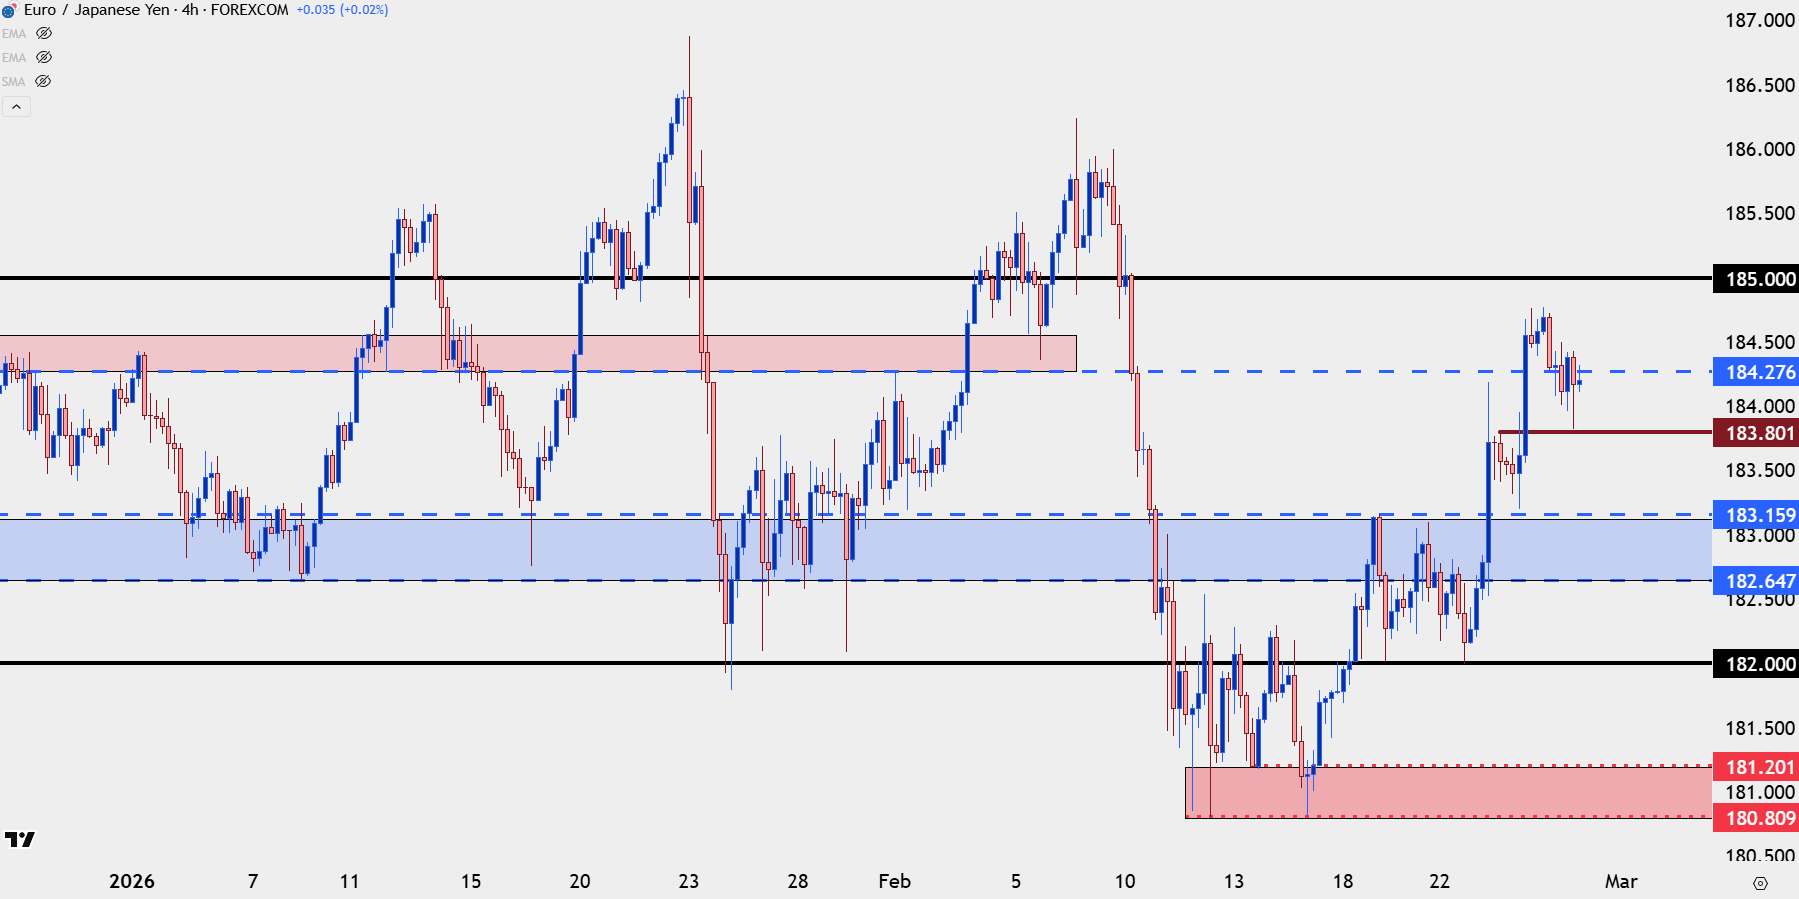
Chart prepared by James Stanley; data derived from Tradingview
GBP/JPY
As I looked at in the Tuesday webinar the setup in GBP/JPY has a bit more historical relevance as current support is around the 2024 highs in the vicinity of the 208 level.
GBP/JPY Weekly Chart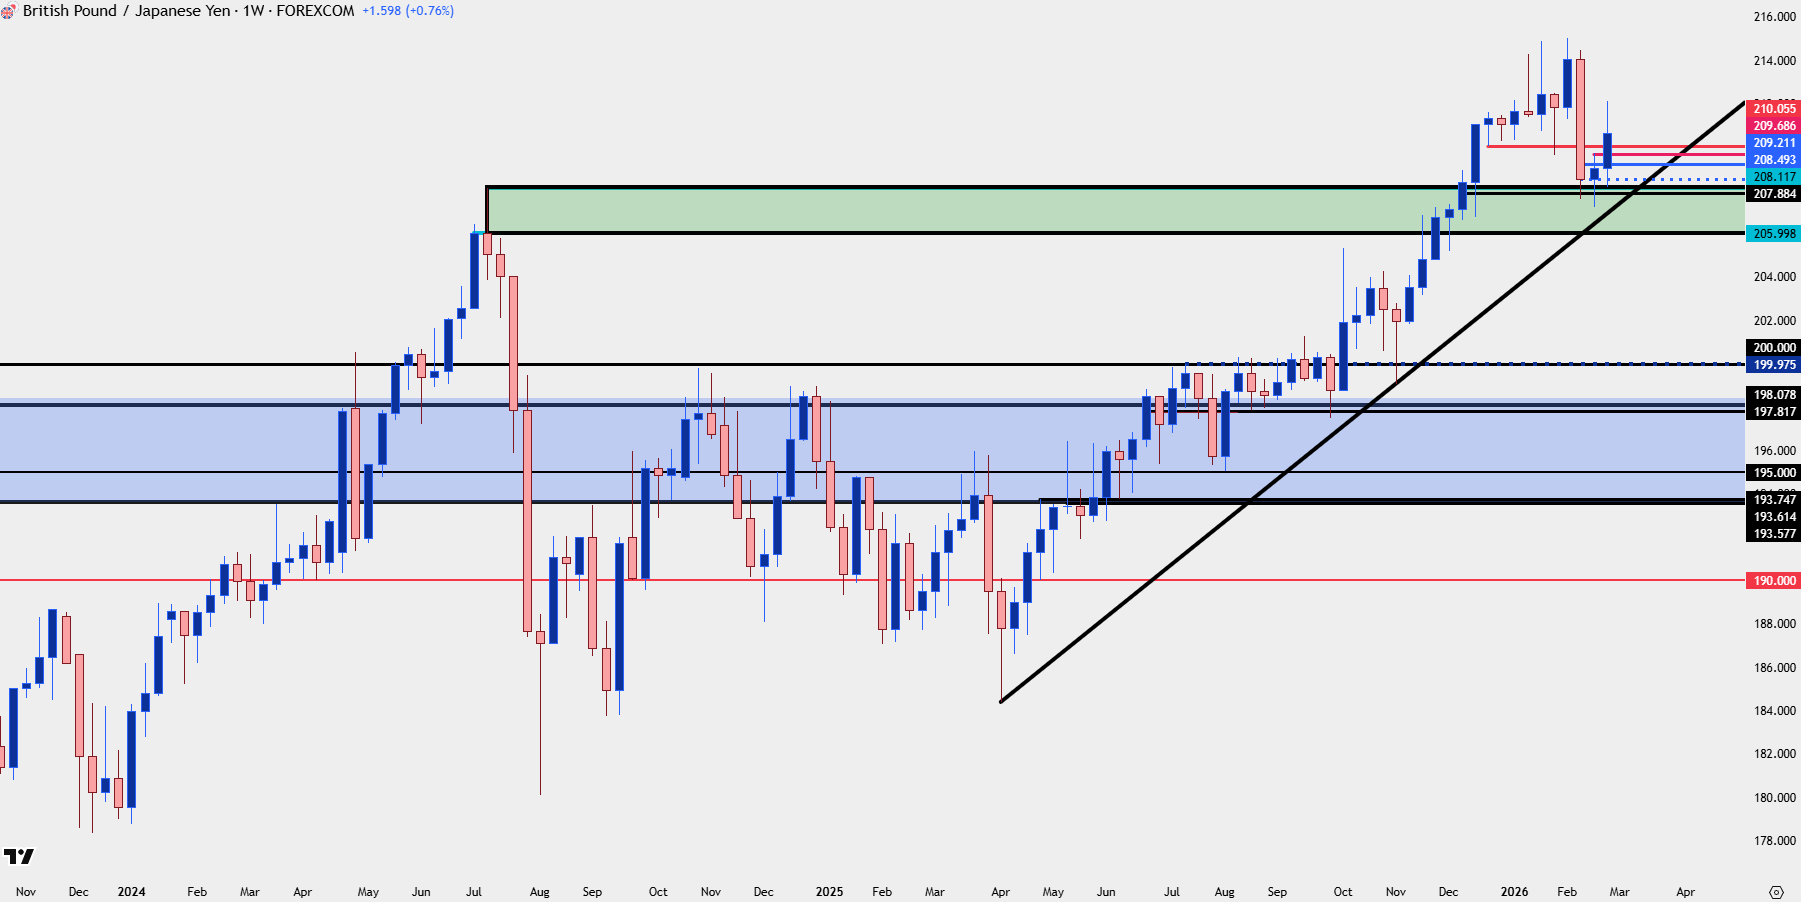
Chart prepared by James Stanley; data derived from Tradingview
On a shorter-term basis we’ve already seen a deeper pullback here than what’s shown above in EUR/JPY or USD/JPY and it’s the 210 level that stands out. This is a spot that’s already shown support multiple times and a zone can be created down to the prior swing low of 209.62, which I’m considering as ‘s1’ support for the setup. Below that, the next meaningful area is that 208.12 level which as you can see from the below four-hour chart, has already seen several inflections. I want to consider that as an ‘s3’ area of support, which would leave a bit of interpretation for an ‘s2’ area given how much grind had taken place before the turn began. The 209 area makes sense for such as this is confluent with the 23.6% Fibonacci retracement of the recent pullback – and other levels from that retracement test out fairly well thereby offering a degree of validation.
GBP/JPY Four-Hour Chart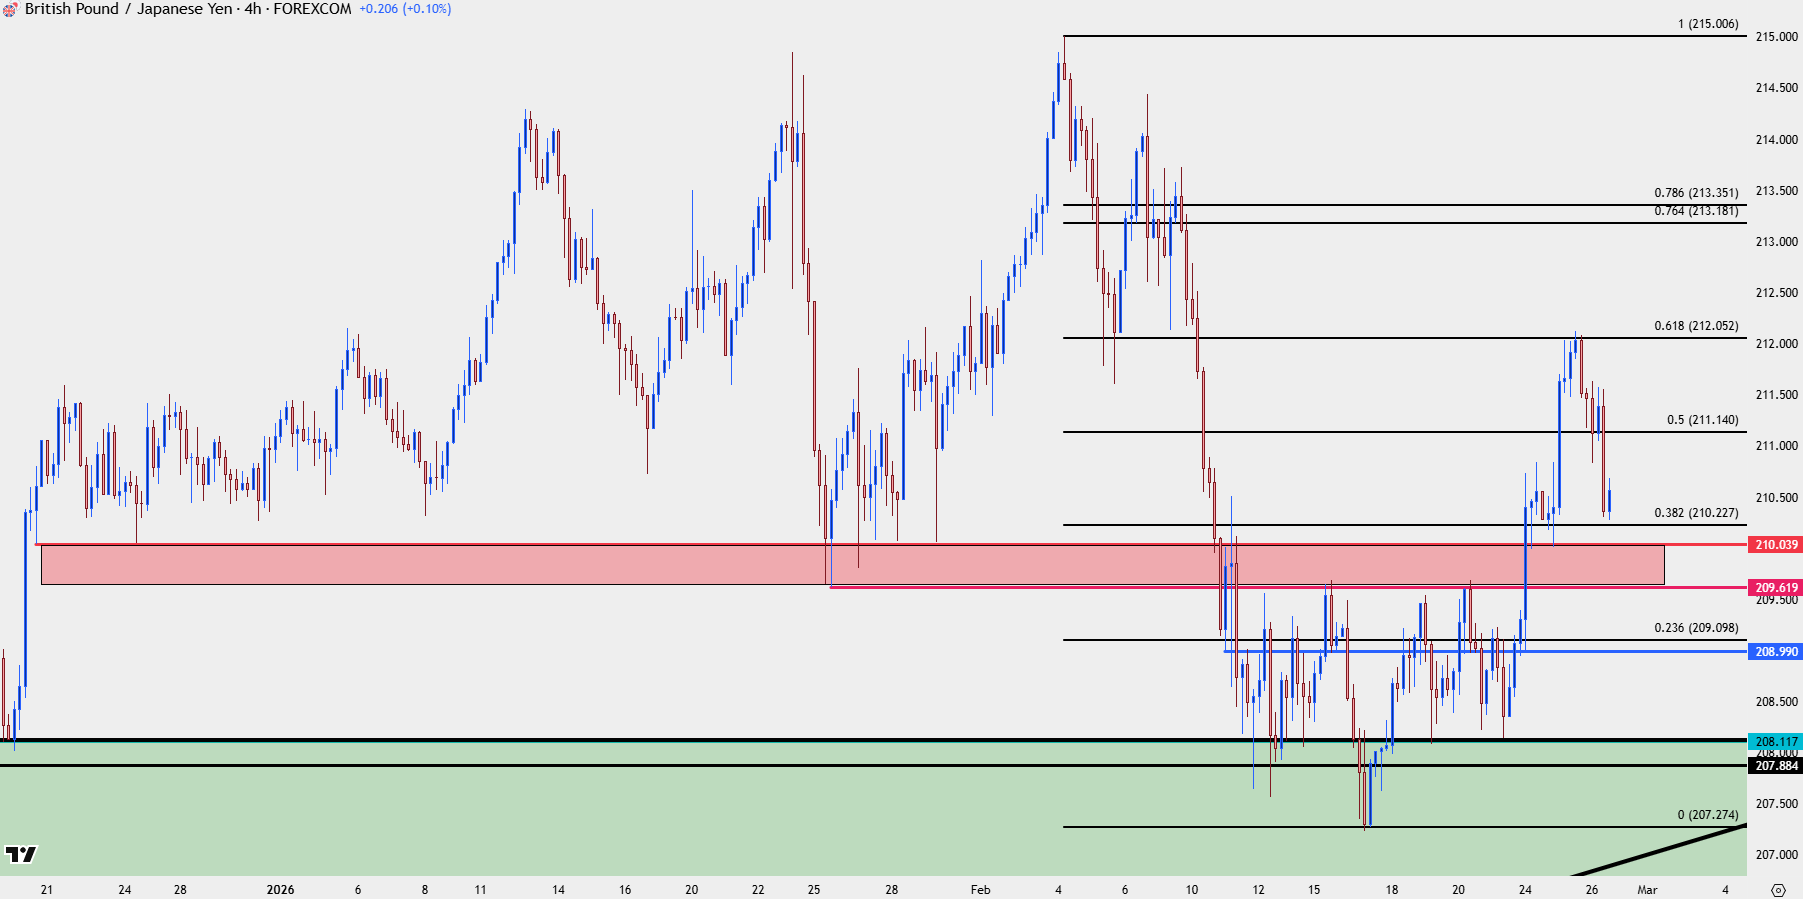
Chart prepared by James Stanley; data derived from Tradingview
--- written by James Stanley, Senior Market Analyst, Global Macro