






USD/JPY squares up to 152 again, AUD/USD lower post ISM: Asian Open
A stronger-than-expected ISM manufacturing report sent the US yield curve and the dollar higher, sending USD/JPY within reach of 152 and AUD/USD lower.
Share this:

Market Summary:
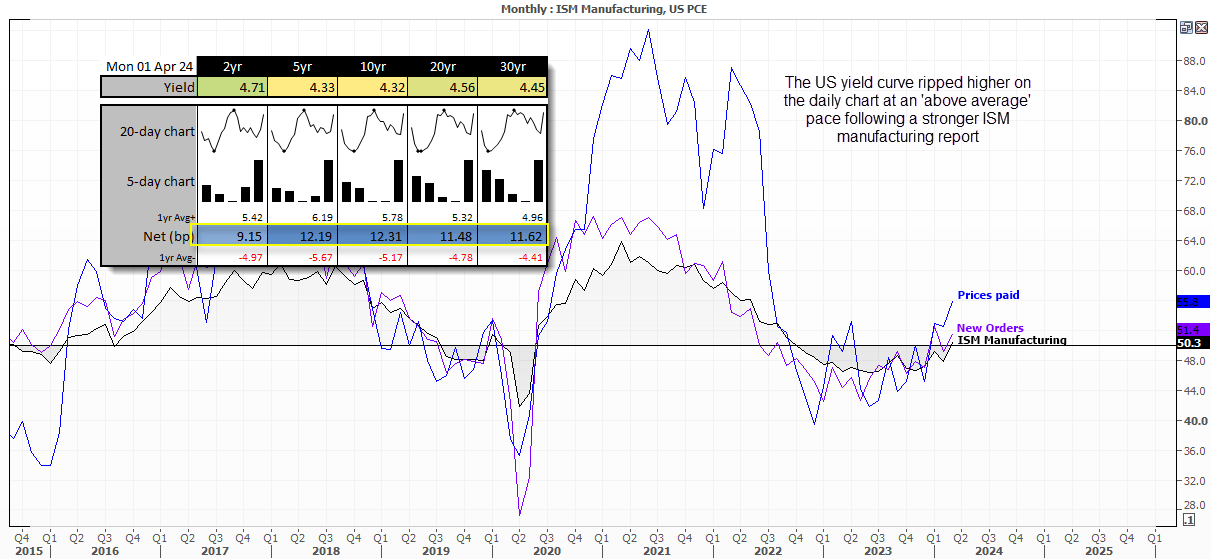
ISM manufacturing expanded (above 50) for the first month in 18 in March, with 'new orders' and 'prices paid' expanding in tandem.
'Prices paid' is generally more volatile and expanded at its fastest pace since June 2022. But still, there's no immediate signs of a top for these inflationary pressures, and core PCE remains at 2.8% y/y (Fe target is 2%).
This saw the US yield curve rip higher at an 'above average' pace on the daily chart and the US dollar rise against all FX majors. The US dollar index finally touched my 105 target before pulling back slightly, having broken above trend resistance form the 2022 high on Thursday.
It could be a big week for the US dollar and global markets in general with the ISM services and nonfarm payroll reports more than capable of single-handedly swaying sentiment for Fed policy this year. As any continued strength in these reports likely bolster bullish bets for these markets on renewed doubts of the Fed’s ability to cut rates multiple times ahead of the US election.
- GBP/USD was the weakest major and fell to an 8-week low, on bets the BOE could cut rates sooner and more aggressively than the Fed, even if the BOE recently said markets were pricing in 'too many' cuts.
- USD/JPY formed a bullish engulfing bar on the daily chart, which brings another crack into focus (a level it has failed to touch since 1990 and Japan’s officials seem keen to verbally intervene when it nears it).
- AUD/USD teased with a break beneath Thursday’s low and shows the potential to move lower from here if US yields and the dollar continue to rise
- Gold reached a fresh record high and broke above $2050, however it looks set to form a bearish pinbar in the daily chart which suggests a near-term signs of exhaustion. Although the low-volume trade of East Monday also needs to be factored in.
- China’s manufacturing PMI also expanded slightly for the fist time in six months according to official data from NBS. At 50.8, manufacturing PMI is its most expansive in in 1-year, services PMI rose at its fastest pace in 9 months and the composite in 10 months
- The private Caixin PMI manufacturing read also expanded at 51.1, its fastest rise in 13 months
Events in focus (AEDT):
- 09:00 – Australian manufacturing PMI
- 09:10 – RBA Assistant Governor Kent speaks (The Future System for Monetary Policy Implementation – at the Bloomberg Australia Briefing)
- 09:50 – Fed member Cook speaks
- 10:00 – South Korean inflation 9Not a market mover, but can be good to keep an eye on Asian inflation figures for general sentiment)
- 11:30 – RBA minutes, Australian job adverts (ANZ)
USD/JPY technical analysis:
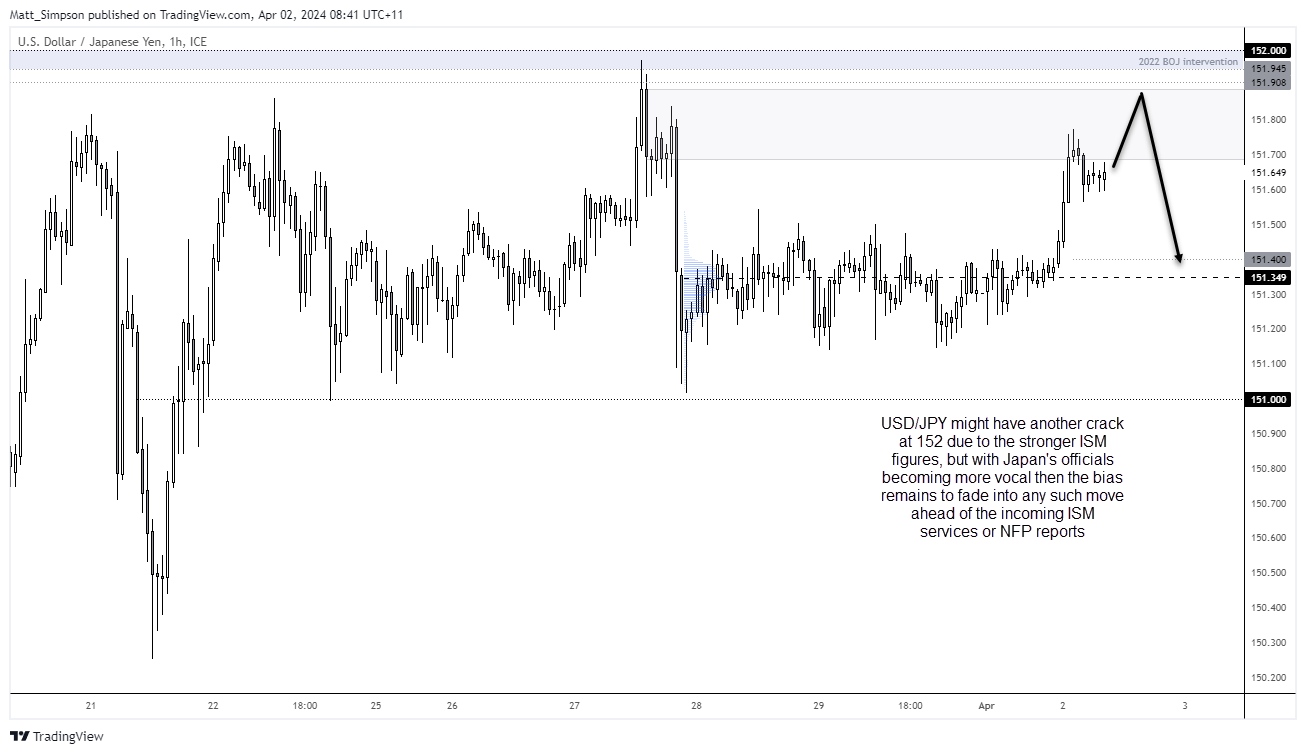
The significance of 152 has not gone unnoticed on USD/JPY, given it has failed to touch that level since June 1990. It came very close and within three pips of the milestone level on Wednesday, but no cigar. A small bullish engulfing day formed and places USD?JPY less than a day’s trade away from the infamous 152 level. But traders would be wise to remember that Japan’s officials become increasingly verbal against a weaker yen, the closer USD/JPY trades to 152.
Knowing markets, I suspect they’ll have another crack at 152 anyway as Asian traders may want to respond to the strong ISM manufacturing report. But I continue feel any such move may be met with a selloff, and for USD/JPY to remain within the 101-152 range at least until the ISM services or NFP reports arrive to break the deadlock.
AUD/USD technical analysis:
AUD/USD closed beneath 65c for the first time this month on Monday, and it shows the potential to move lower from here. I had outlined a potential head and shoulders top last week, yet such patterns require an aggressive break of the neckline – and that does not appear to have occurred. Regardless, a break of the 0.6477 low assumes further downside and brings the Q4 open / 0.6450 level into focus for bears.
We may see a minor bounce from current levels today, but we much keep I mind that the assistance RBA governor speaks and the minutes are released at 11:30 AEDT, and if dovish enough could prompt the next leg lower.
View the full economic calendar
View the full economic calendar
-- Written by Matt Simpson
Follow Matt on Twitter @cLeverEdge
How to trade with City Index
You can trade with City Index by following these four easy steps:
- Open an account, or log in if you’re already a customer
• Open an account in the UK
• Open an account in Australia
• Open an account in Singapore
- Search for the market you want to trade in our award-winning platform
- Choose your position and size, and your stop and limit levels
- Place the trade
Related tags:


Open an account in minutes
Experience award-winning platforms with fast and secure execution, and enjoy tight spreads from 0.5 pts on FX and 0.3 pts on indices.
Economic calendar
Web Trader platform
Our sophisticated web-based platform is packed with features.
Related articles
USD/CAD shooting star puts September surge on notice
USD/CAD has printed a clear bearish reversal pattern after an extraordinary September surge, but confirmation may depend heavily on how US Treasury yields react to Friday’s payrolls report.

USD/CHF Reverses as Swiss Franc Surges amid Bond Carnage
USD/CHF reverses from channel resistance as bond volatility surges and broad Swiss franc strength points to a possible carry-trade unwind.

USD/MXN Analysis: Is Super Peso Starting to Fade?
Over recent trading sessions, the Mexican peso has continued to show signs of weakness against the U.S. dollar. This can already be seen in USD/MXN, which has gained more than 1.7% over the last three sessions, highlighting sustained buying pressure in favor of the dollar in the short term.

This report is intended for general circulation only. It should not be construed as a recommendation, or an offer (or solicitation of an offer) to buy or sell any financial products. The information provided does not take into account your specific investment objectives, financial situation or particular needs. Before you act on any recommendation that may be contained in this report, independent advice ought to be sought from a financial adviser regarding the suitability of the investment product, taking into account your specific investment objectives, financial situation or particular needs.
StoneX Financial Pte. Ltd., may distribute reports produced by its respective foreign entities or affiliates within the StoneX group of companies or third parties pursuant to an arrangement under Regulation 32C of the Financial Advisers Regulations. Where the report is distributed to a person in Singapore who is not an accredited investor, expert investor or an institutional investor (as defined in the Securities Futures Act), StoneX Financial Pte. Ltd. accepts legal responsibility to such persons for the contents of the report only to the extent required by law. Singapore recipients should contact StoneX Financial Pte. Ltd. at 6826 9988 for matters arising from, or in connection with the report.
In the case of all other recipients of this report, to the extent permitted by applicable laws and regulations neither StoneX Financial Pte. Ltd. nor its associated companies will be responsible or liable for any loss or damage incurred arising out of, or in connection with, any use of the information contained in this report and all such liability is hereby expressly disclaimed. No representation or warranty is made, express or implied, that the content of this report is complete or accurate.
StoneX Financial Pte. Ltd. is not under any obligation to update this report.
Trading CFDs carries a high level of risk that may not be suitable for some investors. Consider your investment objectives, level of experience, financial resources, risk appetite and other relevant circumstances carefully. The possibility exists that you could lose some or all of your investments, including your initial deposits. If in doubt, please seek independent expert advice. Visit www.forex.com/en-sg/terms-and-policies for the complete Risk Disclosure Statement.