




U.S. Dollar Price Action Setups: EUR/USD, GBP/USD, USD/JPY, USD/CAD
USD went oversold on both the daily and weekly chart this week and we’re seeing a short squeeze ahead of the holiday in the U.S.
Share this:

U.S. Dollar Talking Points:
- It was a positive batch of data out of the U.S. on Friday which helped to bring a bounce to the USD.
- Given the oversold backdrop behind DXY ahead of that data the question remains as to whether this was a short-squeeze driven pullback or whether it’s the start of a larger bullish theme, and for that there are several levels and zones to track on associated major pairs as we push into Q3 trade.
- I’ll be looking at the USD from multiple vantage points in the weekly webinar, and you’re welcome to attend the next one. Click here to register.
The first half of 2025 was rough for USD bulls and that comes in stark contrast to the way that the year had started. While RSI on the weekly DXY chart was overbought at the beginning of the year an aggressive short-side trend pushed the indicator into oversold territory just four months later. And that hasn’t necessarily stopped sellers from going for more, as RSI dipped below 30 again last week and, as of this writing, is below the 30 threshold again for this weekly bar.
With that said, RSI is still higher than it was in April and given the lower-low in price and the higher-low via RSI, that sets the stage for possible divergence, which is often tracked with the aim of reversal potential.
It’s still far too early to make the reversal proclamation, however, as all that we have at this point is a very oversold move driven by both dovish FOMC comments and fiscal belt-widening. On Friday, we got a couple pieces of positive data in the form of Non-farm Payrolls and Services PMI, both of which came out above expectations. That helped the USD to recover a bit but given how oversold the move was coming into the morning this could easily have been more of a profit-taking event.
But – notably, many bullish reversals begin as short squeezes so this deserves attention in the coming weeks to see if buyers can make a more persistent approach at driving a pullback in the USD bearish trend.
U.S Dollar Weekly Chart

Chart prepared by James Stanley; data derived from Tradingview
USD Shorter-Term
From the four-hour chart we can get better view of recent structure, and this is an updated look from the Tuesday webinar. From here we can see both a higher-high and a higher-low that have posted since the Q3 open on Tuesday and there’s also resistance levels of note sitting overhead.
This is similar to what I had looked at in early-May ahead of the FOMC rate decision, when the USD was initially pushing off of that oversold backdrop from early-April. I highlighted the 102.00 level as a major decision point, and at that level, bears had an open door to jump in and continue the downtrend following a pullback. That’s precisely what happened, and this is what led to the fresh three-year low that printed last week.
For short-term resistance, there’s a spot of possible support at 97.60. Above that, I’m looking at a decision point from around 97.80 up to 98.02, as this was the zone that caught the lows in April and then helped to hold the lows in June until the late-month breakdown.
Above that, 98.58 is of interest and then the 99.39 level comes into the picture.
If bulls can force a breach above that level, then we may have something for bigger picture reversal attempts. But, until then, I’m considering those levels as areas to read bearish response.
U.S. Dollar Four-Hour Chart

Chart prepared by James Stanley; data derived from Tradingview
EUR/USD
I looked into this one on Tuesday and I had also written about it on the prior Thursday, highlighting a Fibonacci retracement that’s had several points of interest over the past couple of years. From the Tuesday webinar, I showed a zone of prior resistance that was turning into support potential, with level at 1.1686 and 1.1748. The latter came into play the morning after and led to a bounce, but bulls failed to push up to a fresh high and then the USD pullback on Thursday drove price down to a trendline connecting swing lows from late last week.
EUR/USD had similarly pushed into extreme territory with overbought readings on both the weekly and daily charts earlier in the week. So, the current pullback could be squaring up ahead of the holiday weekend as longs take profits following another breakout.
If the pullback does extend, the 1.1686 level would be the next item of interest, and if sellers can push below that, then I’m tracking levels of prior resistance at 1.1632 and 1.1543.
EUR/USD Four-Hour Chart
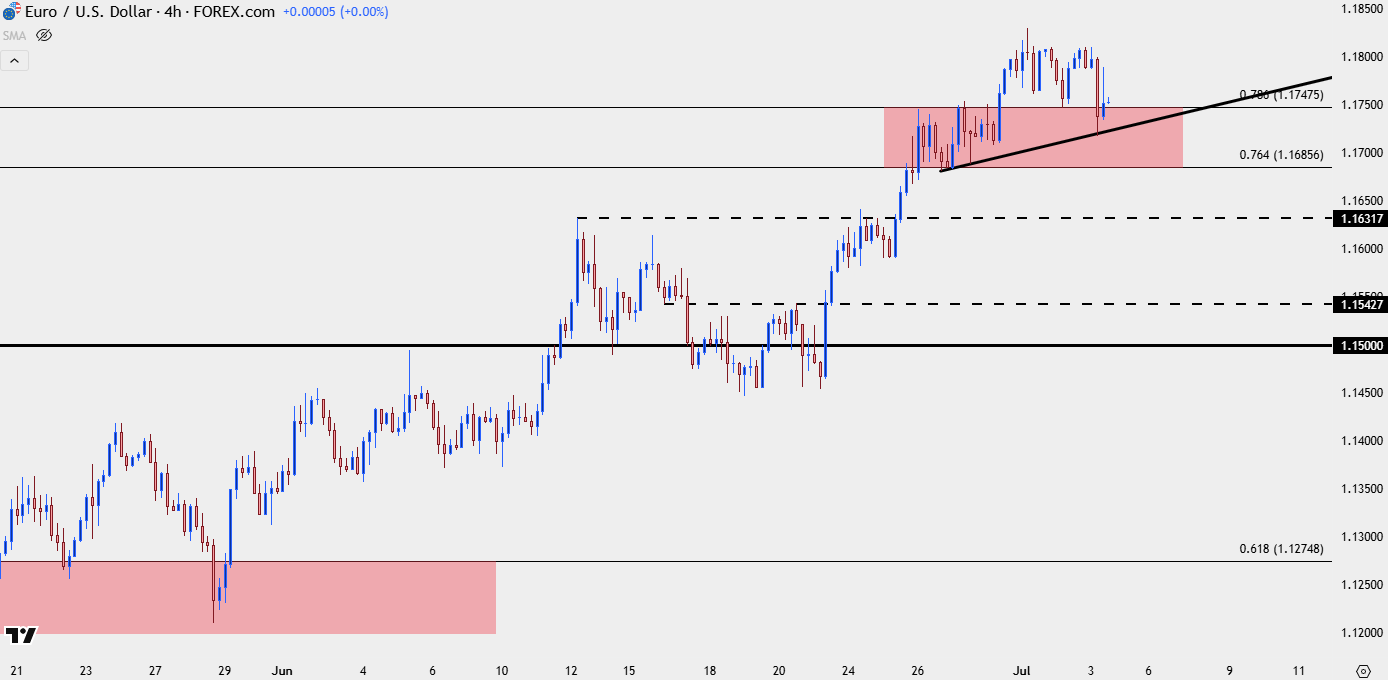
Chart prepared by James Stanley; data derived from Tradingview
GBP/USD
The British Pound took a hit on Thursday and that created a fast push below the 1.3670 level. I had looked into that backdrop in the Tuesday webinar, highlighting the fact that a push of that nature could take out stops and trailed stops from bullish momentum strategies, thereby opening the door for a re-test of the 1.3593-1.3617 zone.
So far – that zone has held up with a short-term higher-low printing on Friday. If we do see USD bears hit the trend aggressively around the end of this week or the open of next week, I think this pair remains attractive for USD-weakness scenarios.
GBP/USD Daily Chart
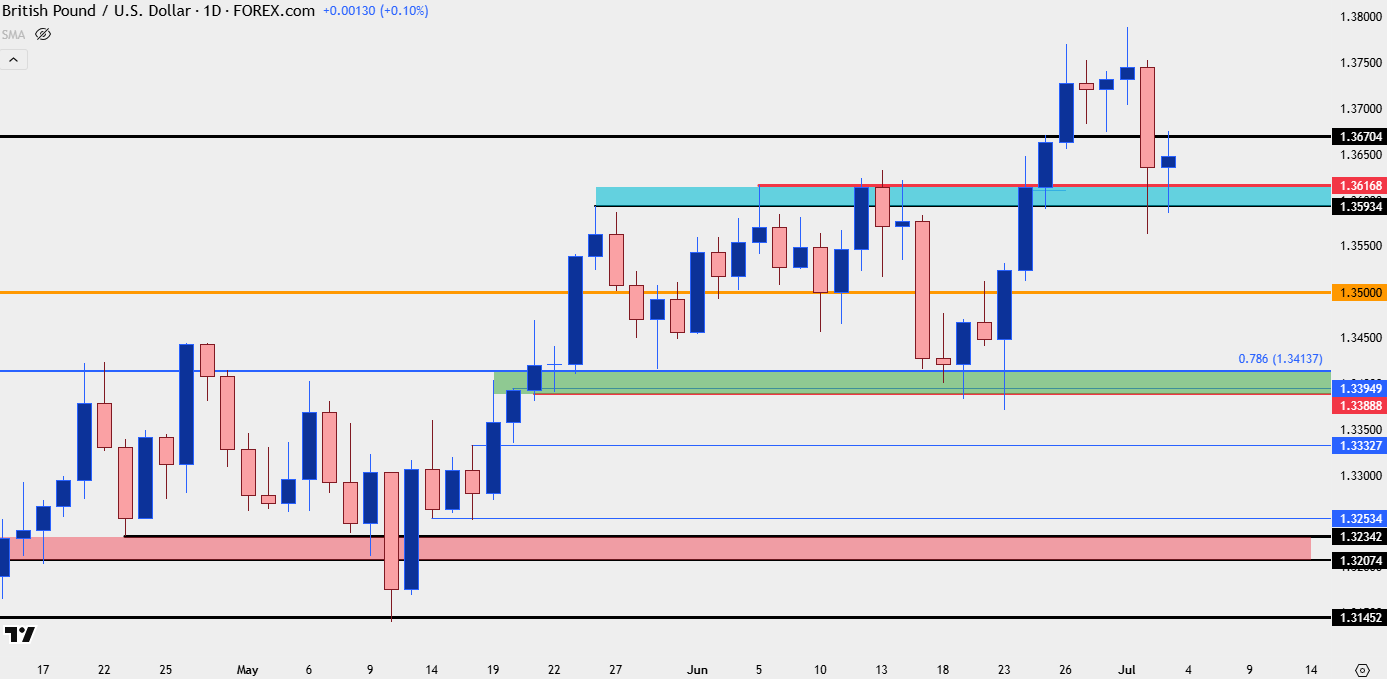
Chart prepared by James Stanley; data derived from Tradingview
USD/JPY 145.00
If we are going to see a larger breakdown in the USD in the second-half of the year, we’re likely going to need to see some participation from USD/JPY, and that’s been a missing element over the past two months.
USD/JPY hit the 140.00 level in April but since then, bulls have held up at a higher-low. In May and early-June, that was at the 142.50 level. Later in the month, buyers held the low just above that psychological level.
Over the past two months this has made for a range-bound backdrop and following this morning’s data, USD/JPY was able to push back-above the 145.00 level for another test. This constitutes both a short-term higher-high and higher-low, and the door is open for buyers to make a push. The next resistance that I’m tracking is the 145.92 level, after which 146.54 comes into the picture. Range resistance has been around the 148.00 level which, so far, has had two brutal rejections in USD/JPY.
USD/JPY Four-Hour Chart
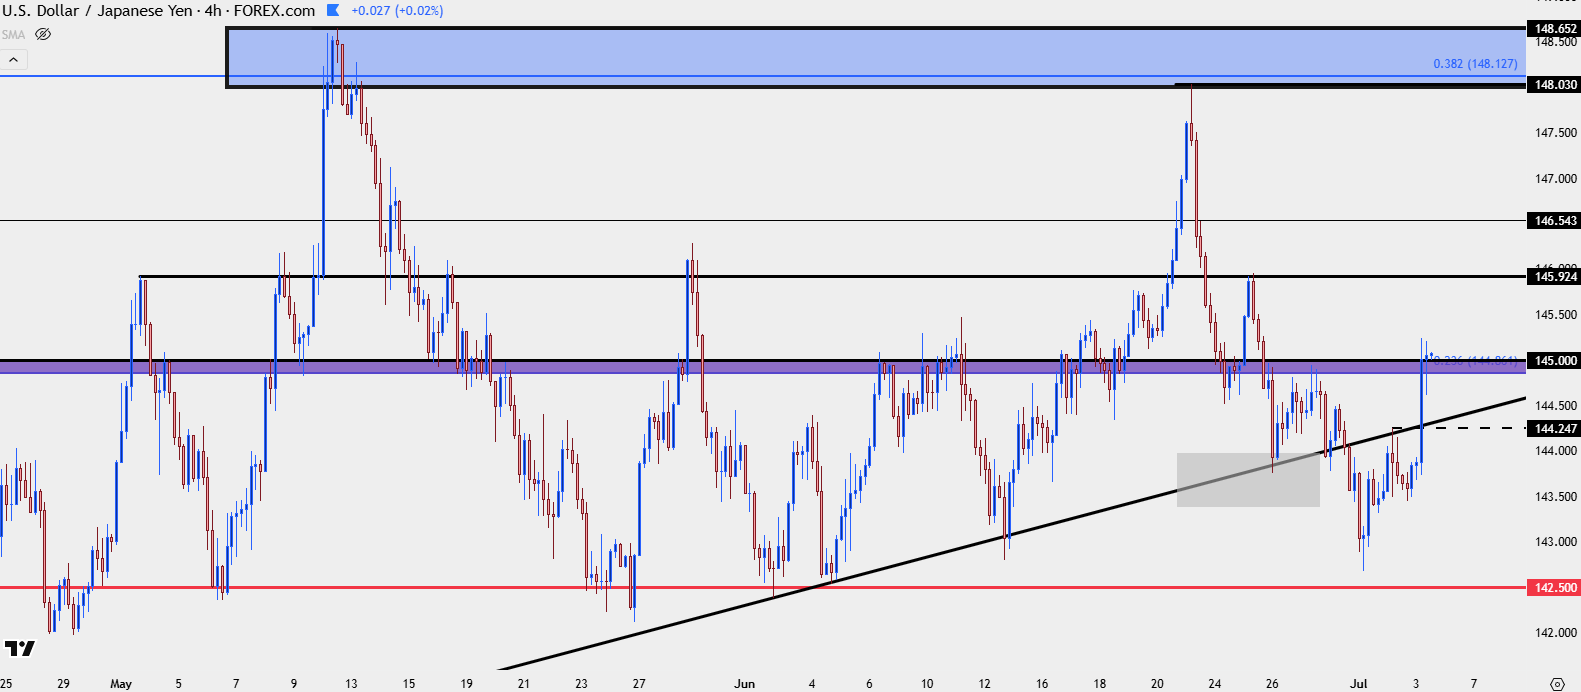
Chart prepared by James Stanley; data derived from Tradingview
USD/CAD
USD/CAD remains on of my favored venues for USD-weakness. Notably the pair is not participating in the USD pullback on the day with USD/CAD inching towards a re-test of 2025 lows despite the rally in DXY that’s visible in EUR/USD and USD/JPY. This does complicate matters from a strategy standpoint but a nearby support level could offer some clarity, as the 1.3500 psychological level could induce profit taking, after which a bounce into a lower-high could be sought.
USD/CAD Daily Chart
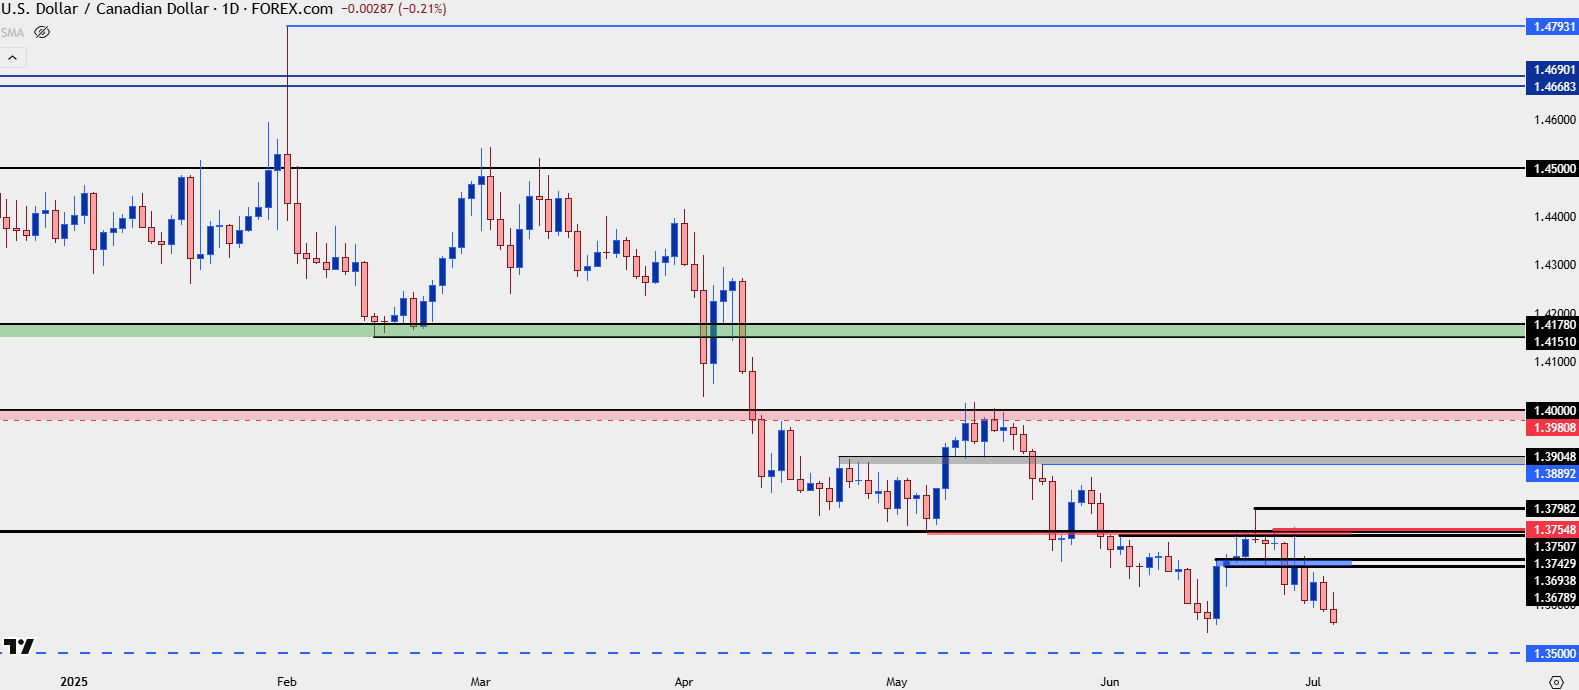
Chart prepared by James Stanley; data derived from Tradingview
--- written by James Stanley, Senior Strategist
Related tags:




Open an account in minutes
Experience award-winning platforms with fast and secure execution, and enjoy tight spreads from 0.5 pts on FX and 0.3 pts on indices.
Economic calendar
Web Trader platform
Our sophisticated web-based platform is packed with features.
Related articles
This report is intended for general circulation only. It should not be construed as a recommendation, or an offer (or solicitation of an offer) to buy or sell any financial products. The information provided does not take into account your specific investment objectives, financial situation or particular needs. Before you act on any recommendation that may be contained in this report, independent advice ought to be sought from a financial adviser regarding the suitability of the investment product, taking into account your specific investment objectives, financial situation or particular needs.
StoneX Financial Pte. Ltd., may distribute reports produced by its respective foreign entities or affiliates within the StoneX group of companies or third parties pursuant to an arrangement under Regulation 32C of the Financial Advisers Regulations. Where the report is distributed to a person in Singapore who is not an accredited investor, expert investor or an institutional investor (as defined in the Securities Futures Act), StoneX Financial Pte. Ltd. accepts legal responsibility to such persons for the contents of the report only to the extent required by law. Singapore recipients should contact StoneX Financial Pte. Ltd. at 6826 9988 for matters arising from, or in connection with the report.
In the case of all other recipients of this report, to the extent permitted by applicable laws and regulations neither StoneX Financial Pte. Ltd. nor its associated companies will be responsible or liable for any loss or damage incurred arising out of, or in connection with, any use of the information contained in this report and all such liability is hereby expressly disclaimed. No representation or warranty is made, express or implied, that the content of this report is complete or accurate.
StoneX Financial Pte. Ltd. is not under any obligation to update this report.
Trading CFDs carries a high level of risk that may not be suitable for some investors. Consider your investment objectives, level of experience, financial resources, risk appetite and other relevant circumstances carefully. The possibility exists that you could lose some or all of your investments, including your initial deposits. If in doubt, please seek independent expert advice. Visit www.forex.com/en-sg/terms-and-policies for the complete Risk Disclosure Statement.