



USD/JPY Forecast: Yen keeps showing persistent weakness
The latest trading sessions continue to show weakness in the Japanese yen. This dynamic is reflected in USD/JPY, which has gained more than 0.7% over the last 3 sessions, highlighting the loss of strength in the Japanese currency.
Share this:

The latest trading sessions continue to show weakness in the Japanese yen. This dynamic is reflected in USD/JPY, which has gained more than 0.7% over the last 3 sessions, highlighting the loss of strength in the Japanese currency.
For now, buying pressure in the pair remains supported by the wide rate differential with the United States, which could even widen over the coming months. In addition, renewed dollar strength, driven by updates in the Middle East, has also supported the advance in USD/JPY.
If these catalysts remain in place, buying pressure in the pair could continue to be relevant over the next few trading sessions.


Is the rate differential still weighing on the yen?
Over the last few months, the rate differential between the United States and Japan has been one of the main factors behind yen weakness. While the Federal Reserve maintains a reference rate of 3.75%, Japan keeps one of the lowest interest rates in the world, near 1.00%.
This difference is also reflected in the bond market. Although bonds in both countries have shown recent increases in yields, the gap remains wide. U.S. 10-year Treasury yields have already reached a new yearly high near 4.7%, while Japan’s 10-year bond yields remain much lower, around 2.7%.
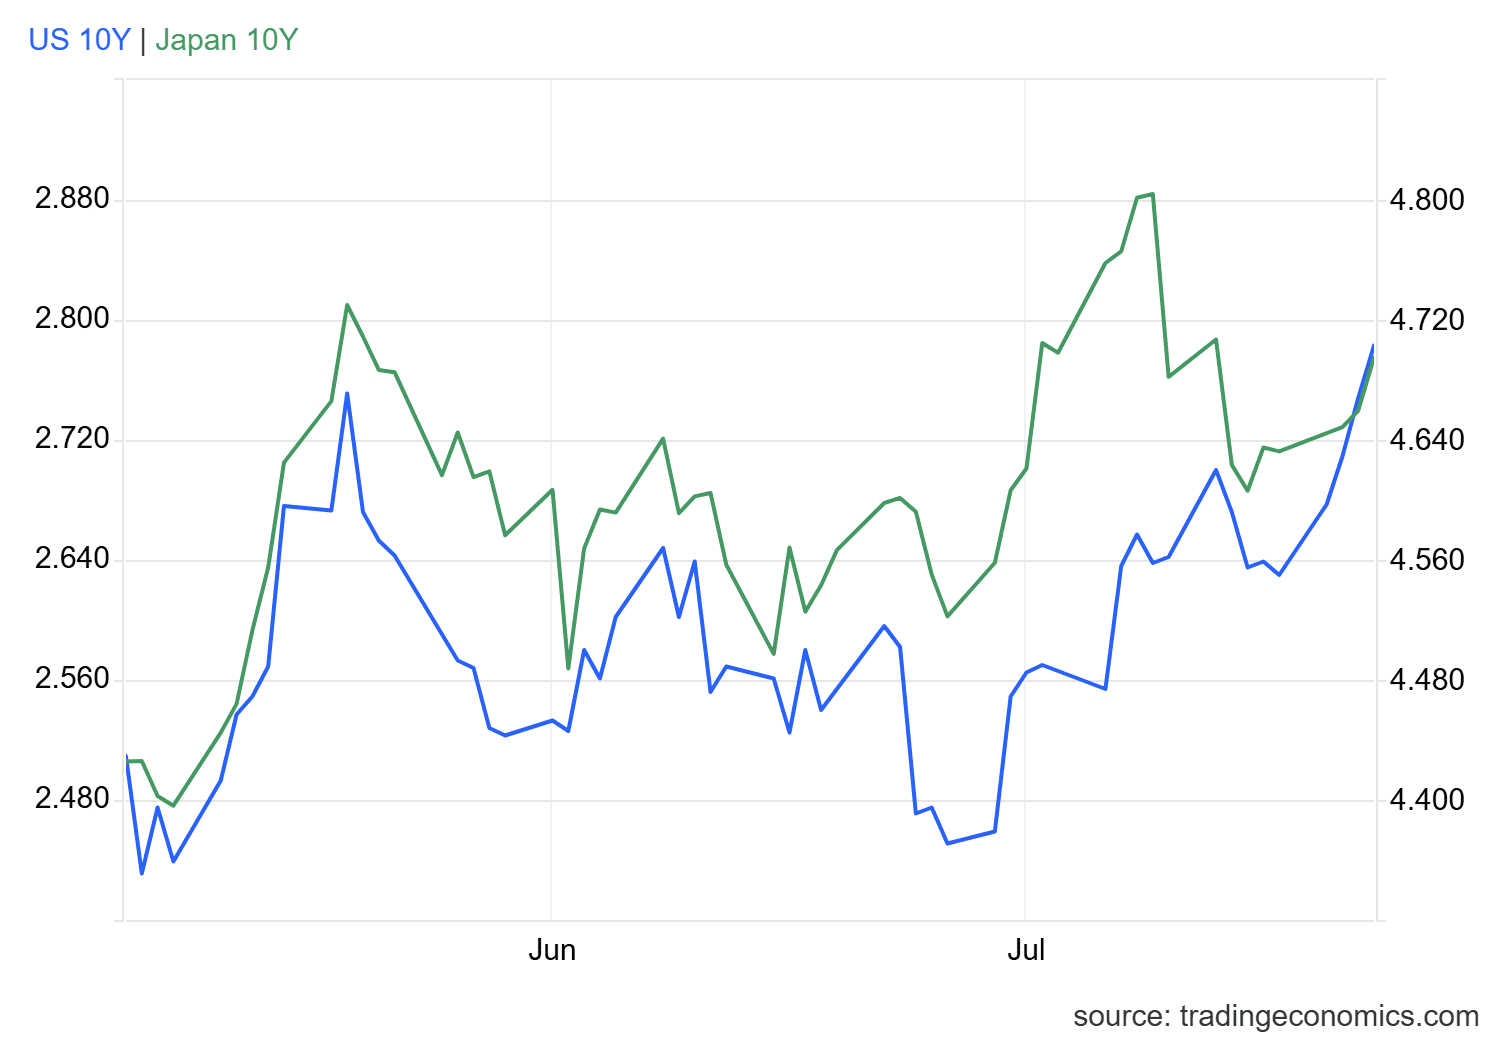
Source: TradingEconomics
This dynamic continues to limit the appeal of the Japanese yen. Higher U.S. bond yields favor dollar-denominated investments over yen-denominated assets, a relationship that has remained in place for several months and has restricted demand for the Japanese currency.
What is relevant now is that this differential could widen even further. So far, there have been no major updates from the Bank of Japan pointing to a possible rate hike. In contrast, the Federal Reserve has started to reflect a higher probability of higher rates over the coming months.
According to the CME Group probability table, for the September 16 decision, there is still a dominant probability above 56% that the United States could deliver a rate hike, which would further widen the differential with Japan.
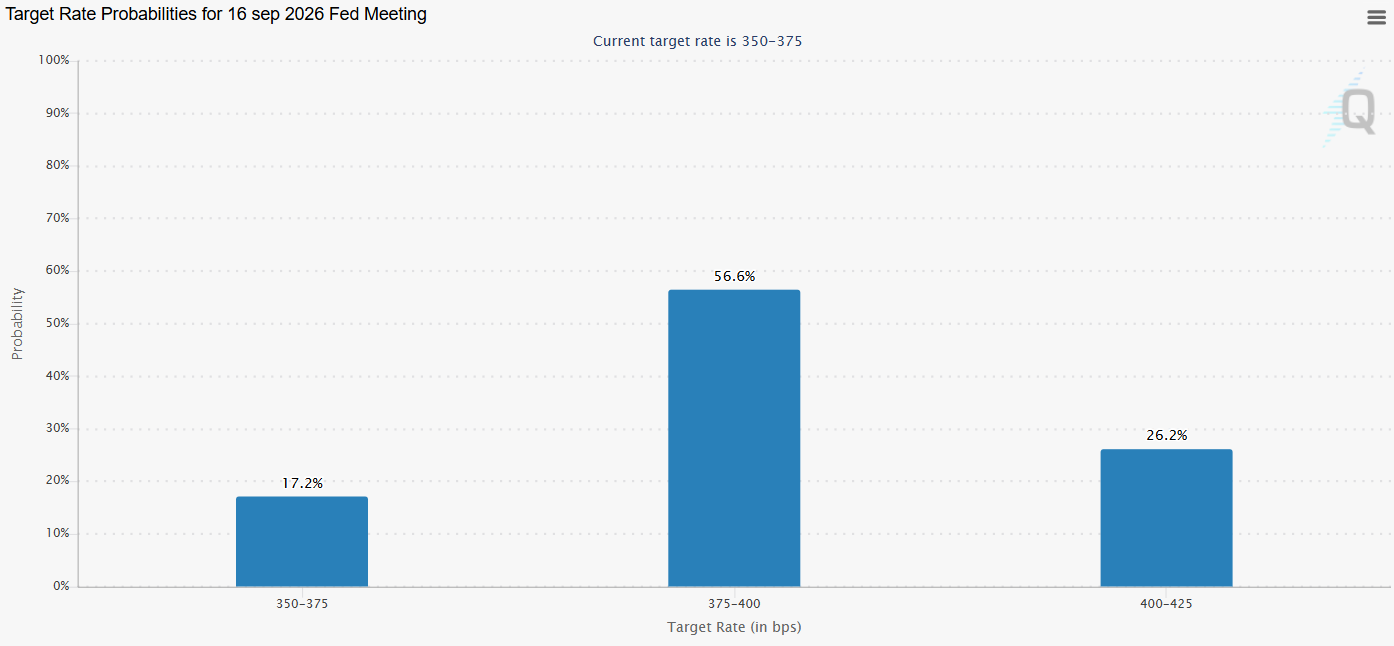
Source: CMEGROUP
As a result, if the market continues to see a stable Bank of Japan with no relevant changes, compared with a potentially more aggressive Federal Reserve, the rate differential could continue to favor the relative appeal of the dollar. This dynamic may make a sustained yen recovery more difficult and could maintain buying pressure in USD/JPY over the next few sessions.
Is Middle East becoming relevant again?
New updates in the Middle East suggest that risk may be increasing not only around the Strait of Hormuz, but also in the Red Sea, following attacks carried out by Iran-backed groups from Yemen. This event adds to new U.S. military actions and reflects a scenario that still appears far from a negotiated solution in the short term.
The escalation continues to support oil prices, increase uncertainty and lift the market’s risk premium.
In this context, the U.S. dollar has started to show a renewed recovery. This is reflected in the DXY index, which measures the dollar’s strength against its main peers, and which has already moved above the 101-point area after several consecutive advances.
This suggests that, as seen in previous months, the dollar could be acting as a liquidity-driven safe-haven currency amid rising tensions in the Middle East.
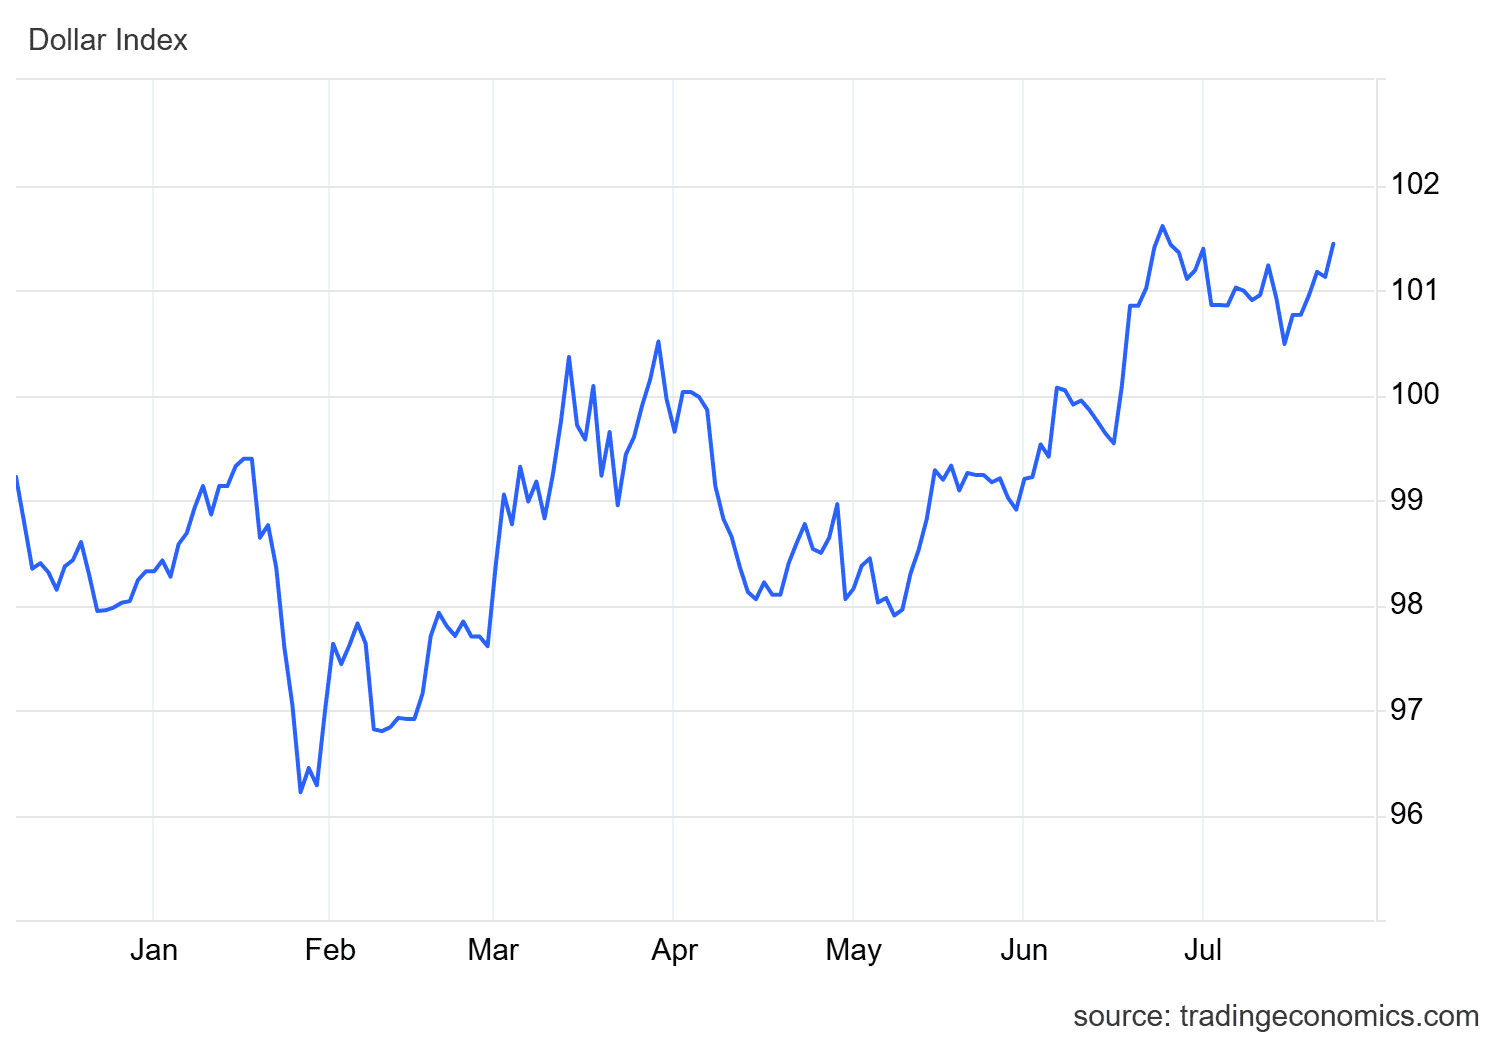
Source: TradingEconomics
This dynamic is also important for the yen. If the conflict continues to escalate and the dollar maintains its strength as a safe-haven asset, the Japanese currency could struggle to regain ground consistently. For this reason, USD/JPY could continue to show buying pressure over the next few trading sessions.
Technical forecast for USD/JPY
Source: StoneX, Tradingview
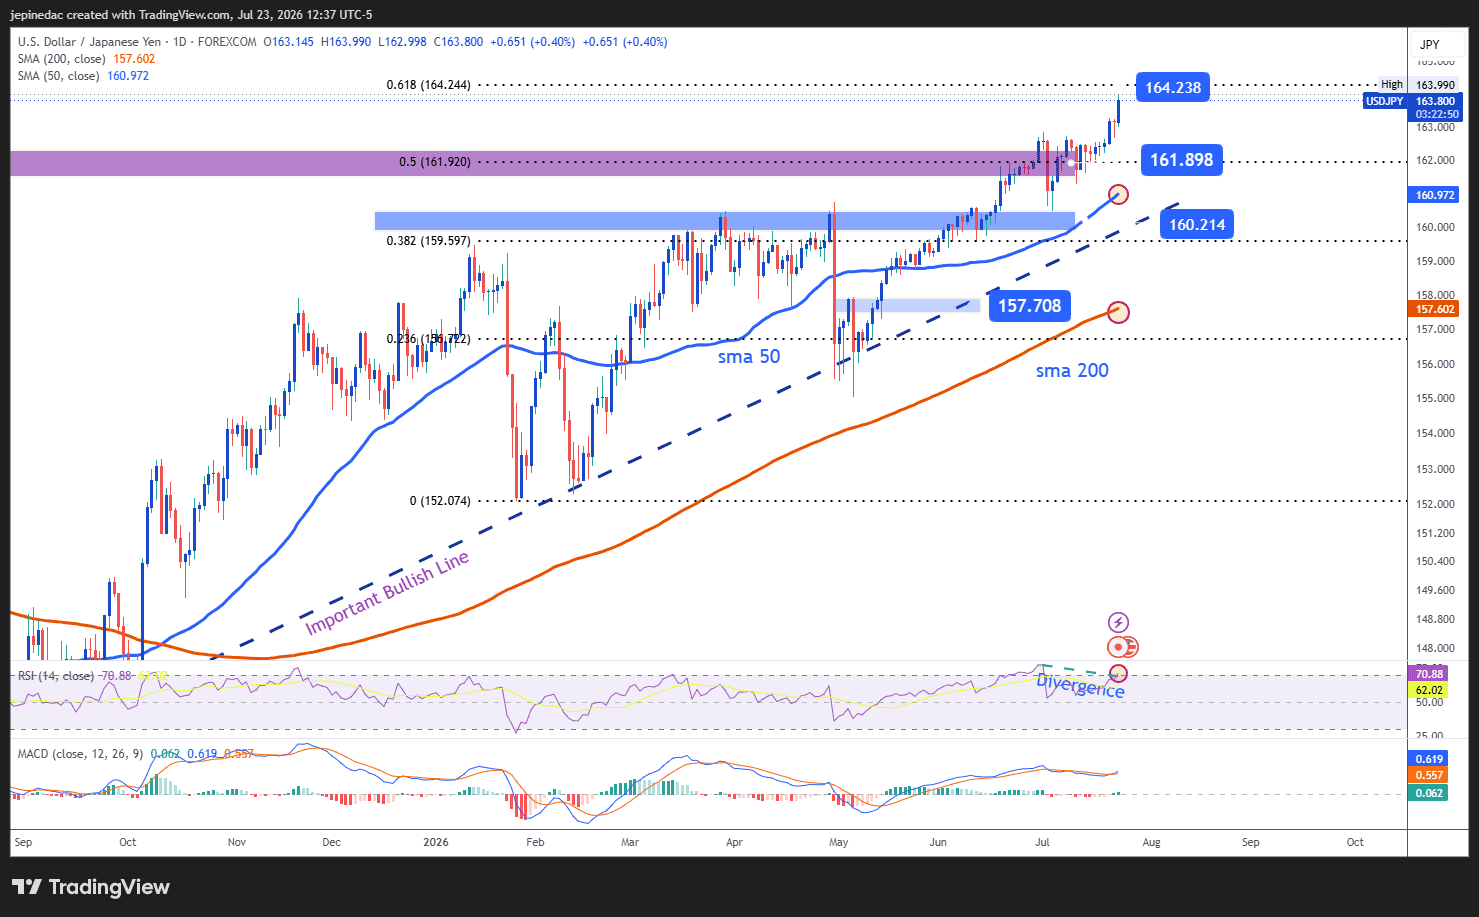
- Bullish trend appears unstoppable: For several months, USD/JPY has maintained a dominant bullish trend line. This structure remains the most relevant pattern on the chart, especially due to the lack of selling moves strong enough to put the main trend at risk. As long as buying pressure remains in place, this trend line could continue to act as the dominant technical reference over the next few sessions.
- RSI: The RSI remains above the neutral 50 level, reflecting dominant buying impulses in the short term. However, it is also important to note that the indicator has started to form lower highs, while USD/JPY price action continues to register higher highs. This dynamic has created a possible bearish divergence, which could warn of excessive recent buying pressure and open room for potential short-term corrections
- MACD: The MACD shows a histogram increasingly close to the neutral 0 area. This suggests that the strength of short-term moving averages is starting to balance out. For this reason, the indicator could also be anticipating a phase of greater neutrality on the chart over the next few sessions.
Key levels:
- 164.238 – Key resistance: Given the lack of relevant references from previous years, this level coincides with the 61.8% area of a trend-based Fibonacci extension. If price manages to approach this zone again, it could reinforce the buying bias and keep the bullish trend line as the dominant structure.
- 161.898 – Near-term barrier: This area works as an important technical reference, as it coincides with the highs recorded in previous weeks. It could also act as a tentative barrier in case of possible short-term corrections.
- 160.214 – Main support: This area remains the most relevant support on the chart. In addition to coinciding with recent retracements and acting as a psychological market level, it also aligns with the base of the major bullish trend line. Moves that approach this level again could put the bullish structure at risk and open room for a more relevant selling bias over the coming weeks.
Written by Julian Pineda, CFA, CMT – Market Analyst
Follow him on: @julianpineda25


Open an account in minutes
Experience award-winning platforms with fast and secure execution, and enjoy tight spreads from 0.5 pts on FX and 0.3 pts on indices.
Economic calendar
Web Trader platform
Our sophisticated web-based platform is packed with features.
Related articles
AUD/USD, NZD/USD Outlook: Corrective Recoveries Face Growing Headwinds
A weaker US dollar, falling Treasury yields and renewed demand for cyclical assets have supported the Aussie and Kiwi. But with some of those moves reversing on Monday, both currencies face an early test of whether their recent strength can continue.

Canadian Dollar Defies Soft CPI as Inflation Expectations Rise
The Canadian dollar strengthens despite CPI missing expectations, as rising long-term inflation expectations complicate the BoC outlook for USD/CAD and AUD/CAD.


Crude Oil Analysis: WTI Approaches $100 Amid Growing Supply Risks
Recent trading sessions continue to highlight a strong bullish bias across the oil market. As reflected in the performance of WTI crude, prices have maintained a solid recovery since the beginning of October and are now up more than 12% since October 8, a development that continues to underline the strength of demand in the short term.
This report is intended for general circulation only. It should not be construed as a recommendation, or an offer (or solicitation of an offer) to buy or sell any financial products. The information provided does not take into account your specific investment objectives, financial situation or particular needs. Before you act on any recommendation that may be contained in this report, independent advice ought to be sought from a financial adviser regarding the suitability of the investment product, taking into account your specific investment objectives, financial situation or particular needs.
StoneX Financial Pte. Ltd., may distribute reports produced by its respective foreign entities or affiliates within the StoneX group of companies or third parties pursuant to an arrangement under Regulation 32C of the Financial Advisers Regulations. Where the report is distributed to a person in Singapore who is not an accredited investor, expert investor or an institutional investor (as defined in the Securities Futures Act), StoneX Financial Pte. Ltd. accepts legal responsibility to such persons for the contents of the report only to the extent required by law. Singapore recipients should contact StoneX Financial Pte. Ltd. at 6826 9988 for matters arising from, or in connection with the report.
In the case of all other recipients of this report, to the extent permitted by applicable laws and regulations neither StoneX Financial Pte. Ltd. nor its associated companies will be responsible or liable for any loss or damage incurred arising out of, or in connection with, any use of the information contained in this report and all such liability is hereby expressly disclaimed. No representation or warranty is made, express or implied, that the content of this report is complete or accurate.
StoneX Financial Pte. Ltd. is not under any obligation to update this report.
Trading CFDs carries a high level of risk that may not be suitable for some investors. Consider your investment objectives, level of experience, financial resources, risk appetite and other relevant circumstances carefully. The possibility exists that you could lose some or all of your investments, including your initial deposits. If in doubt, please seek independent expert advice. Visit www.forex.com/en-sg/terms-and-policies for the complete Risk Disclosure Statement.