



VIX Breakout Flashes Warning Signal for Wall Street
The VIX has gapped higher after weeks of subdued volatility, raising questions over whether Wall Street’s relentless rally is becoming vulnerable.
Share this:
Wall Street indices continue to rally with barely a pause, but the VIX is beginning to show early signs that sentiment may be shifting. While it is far too early to call a top in US equities, rising volatility expectations, stretched momentum indicators, and growing demand for VIX hedges suggest traders should at least approach the rally with greater caution. And if a reversal does emerge, the Dow Jones may offer the cleanest bearish setup of the major US indices.
View related analysis:
- How to Read the COT Report to Track Forex Market Sentiment
- US Dollar Coiling, USD/JPY Eyes Resistance Heading into US CPI
- FX Futures Positioning: USD Index, USD/JPY, USD/CAD | COT Report
- AUD/USD Outlook: Aussie Buoyant Ahead of Trump-Xi Summit
- ASX 200 Outlook: Range Trade Persists as Financials and Materials Stabilise
View related analysis:
- How to Read the COT Report to Track Forex Market Sentiment
- US Dollar Coiling, USD/JPY Eyes Resistance Heading into US CPI
- FX Futures Positioning: USD Index, USD/JPY, USD/CAD | COT Report
- AUD/USD Outlook: Aussie Buoyant Ahead of Trump-Xi Summit
- ASX 200 Outlook: Range Trade Persists as Financials and Materials Stabilise
VIX Warning Signals Emerge for Wall Street Indices
VIX Breakout Warning Flashes for US Indices
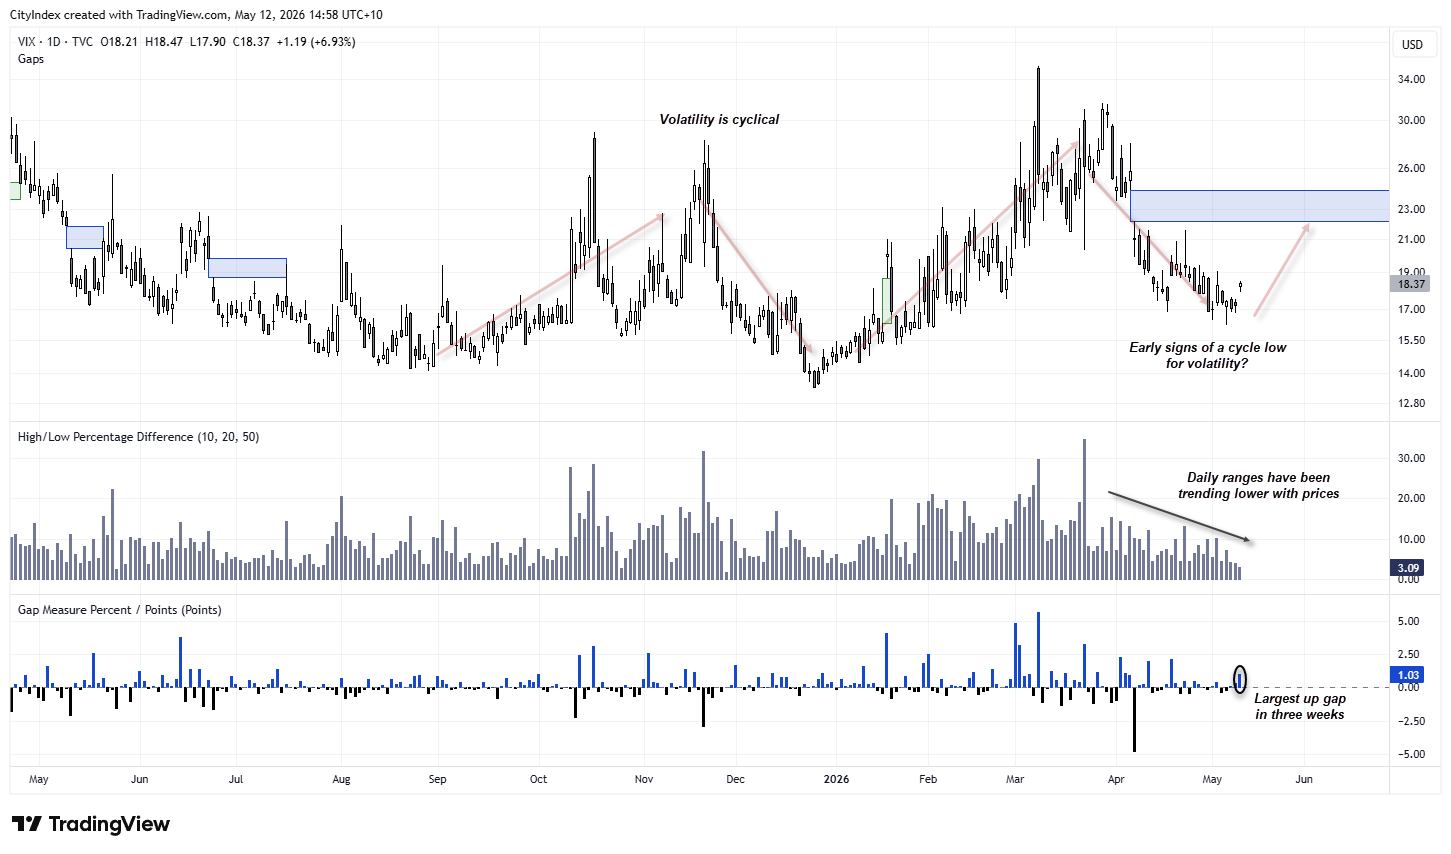
The spot volatility index (VIX) caught my eye today after gapping higher on Monday. While the one-point gap itself is not excessive, the fact it appeared following a consolidation phase just above 16 adds weight to the move in my view. Also note the two lower wicks ahead of the prior two days’ coiling price action, which further raises the risk of a shift in sentiment. Daily high-to-low ranges have also been trending lower since the March high. Add in the fact that volatility — and therefore the VIX — is cyclical and has been trending lower for the past two months, and the case for a pickup in volatility may be building. And if the VIX continues to rise, it usually spells trouble for Wall Street indices.
Source: TradingView


Volatility Index (VIX) Futures Positioning | COT Report
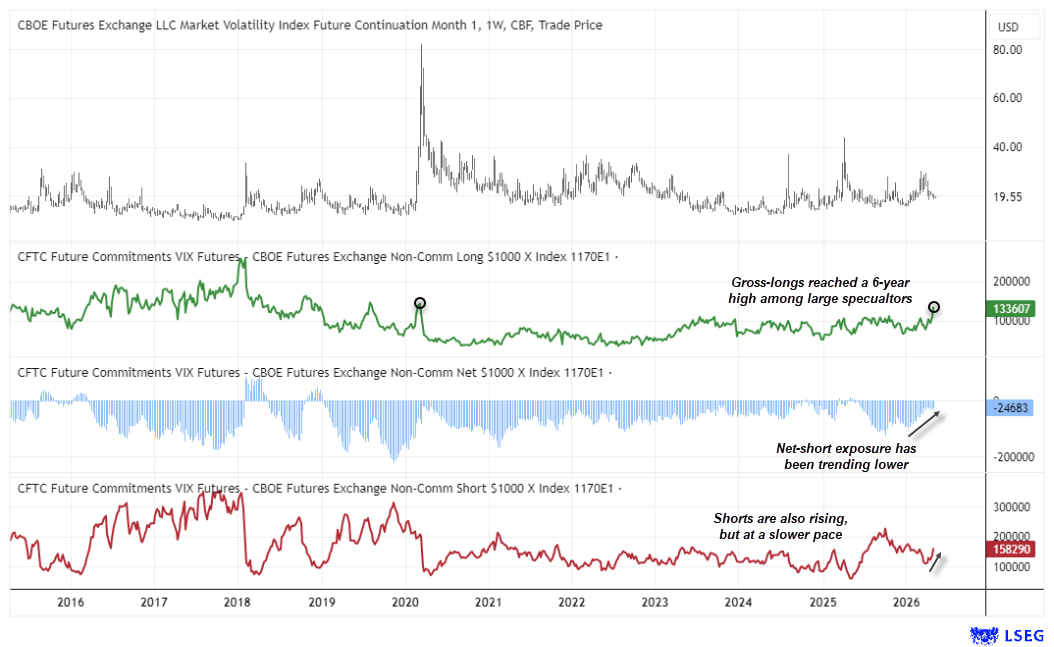
The weekly VIX futures chart highlights the cyclical nature of volatility and its tendency to eventually spike higher. Whether today’s US inflation report proves to be the catalyst remains to be seen. And the threat does not necessarily have to be immediate, as volatility troughs can take time to fully develop. However, when volatility does break higher, it tends to coincide with a more meaningful bout of risk-off sentiment.
Net-short exposure to VIX futures has been trending lower, suggesting less appetite among speculators to bet on subdued volatility. Gross-long exposure has also risen notably in recent weeks, with bullish bets climbing to their highest level since March 2020 at 133.6k contracts.
Source: CME, LSEG
Nasdaq and S&P 500 Extend Rally, but Dow Jones Looks Fragile
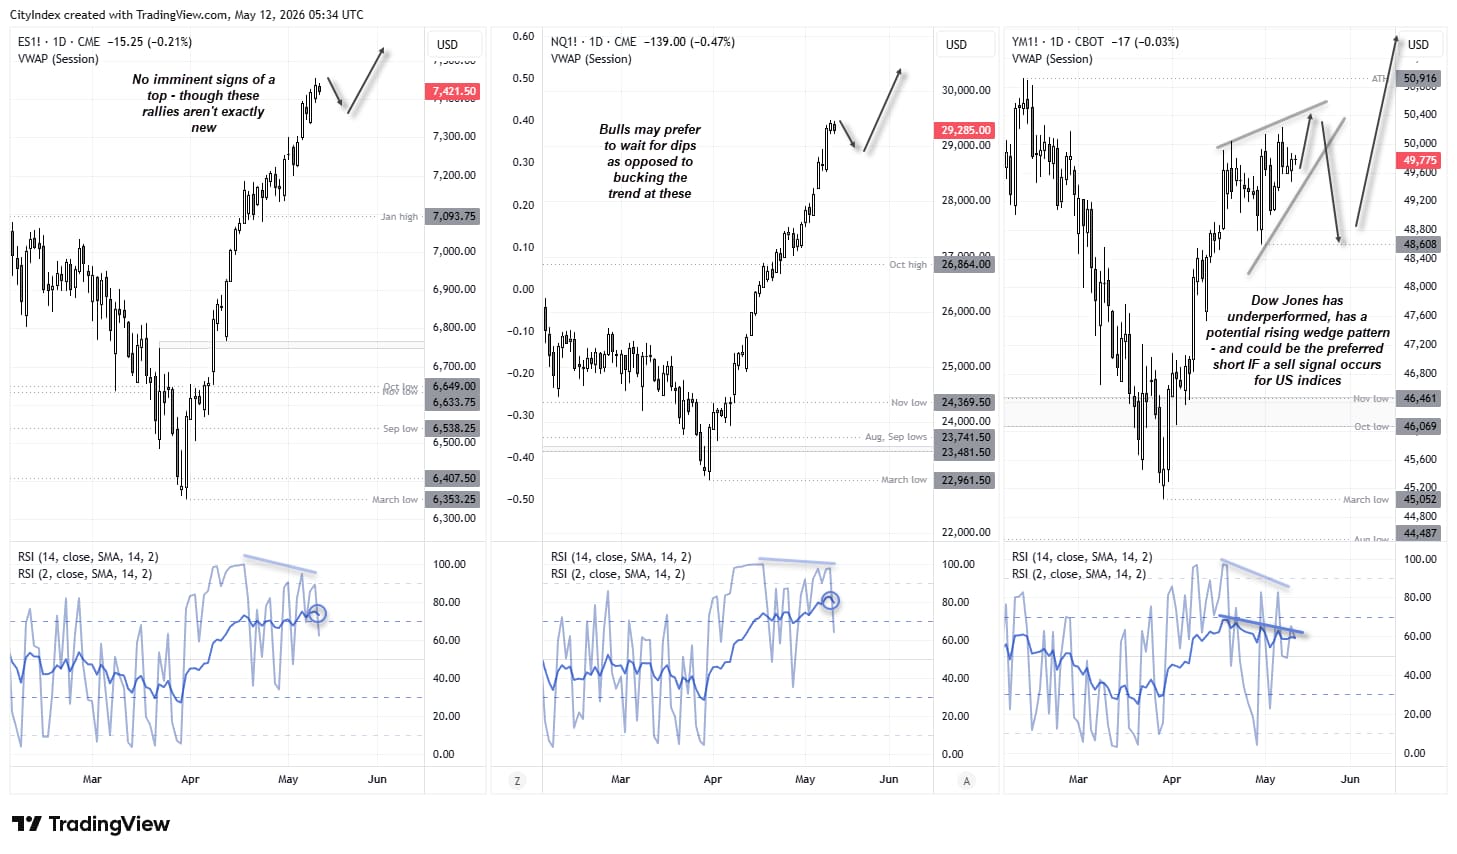
To say US indices have rallied strongly from their March lows would be an understatement. Nasdaq 100 futures have led the charge with a 28.4% gain, while the S&P 500 follows with a 17.3% rise. Neither market has experienced much of a pullback, with prices effectively rising in a straight line. And with no obvious signs of a top just yet, it would be a gamble to short such momentum purely because the VIX has gapped higher.
Still, the signal from the VIX should at least encourage Wall Street bulls to view the rally with greater scrutiny. Bearish divergences have formed on the RSI (2) within overbought territory, while the RSI (14) is also overbought at the time of writing.


Dow Jones Looks Most Vulnerable if Wall Street Turns Lower
But if a sell signal were to emerge on US indices, the Dow Jones would be my preferred vehicle. The Dow has risen just 11.5% from its March low, and price action since mid-April has been choppy enough for a potential rising wedge — a bearish reversal pattern — to form. If confirmed, the wedge projects a downside target towards its cycle low of 38,608.
Source: CME, CBOT, TradingView
View the full economic calendar
View the full economic calendar
-- Written by Matt Simpson
Follow Matt on Twitter @cLeverEdge
How to trade with City Index
You can trade with City Index by following these four easy steps:
- Open an account, or log in if you’re already a customer
• Open an account in the UK
• Open an account in Australia
• Open an account in Singapore
- Search for the market you want to trade in our award-winning platform
- Choose your position and size, and your stop and limit levels
- Place the trade
Related tags:
Latest market news




Open an account in minutes
Experience award-winning platforms with fast and secure execution, and enjoy tight spreads from 0.5 pts on FX and 0.3 pts on indices.
Economic calendar
Web Trader platform
Our sophisticated web-based platform is packed with features.
Related articles

S&P 500 forecast: AI linked stocks remain under pressure
And just like that, it is Friday again and the end of a volatile week. Today offers little on the macro calendar to change the prevailing narrative, leaving markets largely at the mercy of risk appetite, oil prices and the growing unease around the AI trade.

USD/JPY, Nikkei Break Lower as AI Meltdown Spreads
Thursday’s tech tantrum has become Friday’s fire sale. With Nikkei support giving way and the yen strengthening, could the selling start feeding on itself?


Nasdaq, Treasury yields and dollar face a major AI sentiment test
From crude to AI, the forces driving US markets have changed dramatically. Thursday's Nasdaq rout triggered an extraordinary Treasury rally, but the dollar barely moved. What happens next could depend on Nasdaq support.
This report is intended for general circulation only. It should not be construed as a recommendation, or an offer (or solicitation of an offer) to buy or sell any financial products. The information provided does not take into account your specific investment objectives, financial situation or particular needs. Before you act on any recommendation that may be contained in this report, independent advice ought to be sought from a financial adviser regarding the suitability of the investment product, taking into account your specific investment objectives, financial situation or particular needs.
StoneX Financial Pte. Ltd., may distribute reports produced by its respective foreign entities or affiliates within the StoneX group of companies or third parties pursuant to an arrangement under Regulation 32C of the Financial Advisers Regulations. Where the report is distributed to a person in Singapore who is not an accredited investor, expert investor or an institutional investor (as defined in the Securities Futures Act), StoneX Financial Pte. Ltd. accepts legal responsibility to such persons for the contents of the report only to the extent required by law. Singapore recipients should contact StoneX Financial Pte. Ltd. at 6826 9988 for matters arising from, or in connection with the report.
In the case of all other recipients of this report, to the extent permitted by applicable laws and regulations neither StoneX Financial Pte. Ltd. nor its associated companies will be responsible or liable for any loss or damage incurred arising out of, or in connection with, any use of the information contained in this report and all such liability is hereby expressly disclaimed. No representation or warranty is made, express or implied, that the content of this report is complete or accurate.
StoneX Financial Pte. Ltd. is not under any obligation to update this report.
Trading CFDs carries a high level of risk that may not be suitable for some investors. Consider your investment objectives, level of experience, financial resources, risk appetite and other relevant circumstances carefully. The possibility exists that you could lose some or all of your investments, including your initial deposits. If in doubt, please seek independent expert advice. Visit www.forex.com/en-sg/terms-and-policies for the complete Risk Disclosure Statement.