



Weekly Equities Outlook: Oracle, Adobe, Macy’s
Oracle, Adobe and Macy's report this week.
Share this:

Oracle earnings preview
The software and cloud provider will report earnings on Thursday, September 10, after the market closes. Expectations are for fiscal Q1 EPS to rise to $1.74, an 18.5% year-on-year increase, with revenue forecast to rise 28.3% to $19.1 billion. Capital expenditure is expected to more than double to $19.3 billion, up from $18.5 billion just a year earlier.
Looking ahead, Q2 earnings are expected to fall 16% to $1.90. Revenue is forecast to rise 32% to $21.2 billion, while capital expenditure is expected to increase 85% to $22.3 billion.
A key focus will be Oracle Cloud Infrastructure. The market will want to see evidence that the impressive growth rate is sustainable. While growth of 60% to 70%+ in key cloud infrastructure metrics will likely be viewed positively, any slowdown could raise concerns.
Remaining performance obligations, or RPO, will be another area of interest. Oracle had $638 billion of RPO, driven by huge AI and cloud contracts, and investors will want to know whether this enormous backlog is actually converting into revenue. A large RPO would reinforce the AI thesis. Any signs of a slowdown could see investors questioning whether huge AI contracts are translating into economic growth quickly enough.
Another key focus will be AI capex and free cash flow. Despite generating $32 billion of operating cash flow in fiscal 2026, Oracle had negative $23.7 billion of free cash flow owing to enormous data centre investment. The market isn't asking if Oracle's AI business is growing, but how much cash Oracle has to spend to generate that growth.
Oracle has already been heavily impacted by concerns over capex, debt and negative FCF, with the share price some 20% lower this year and still around 60% below its record high last September.
How to trade ORCL earnings
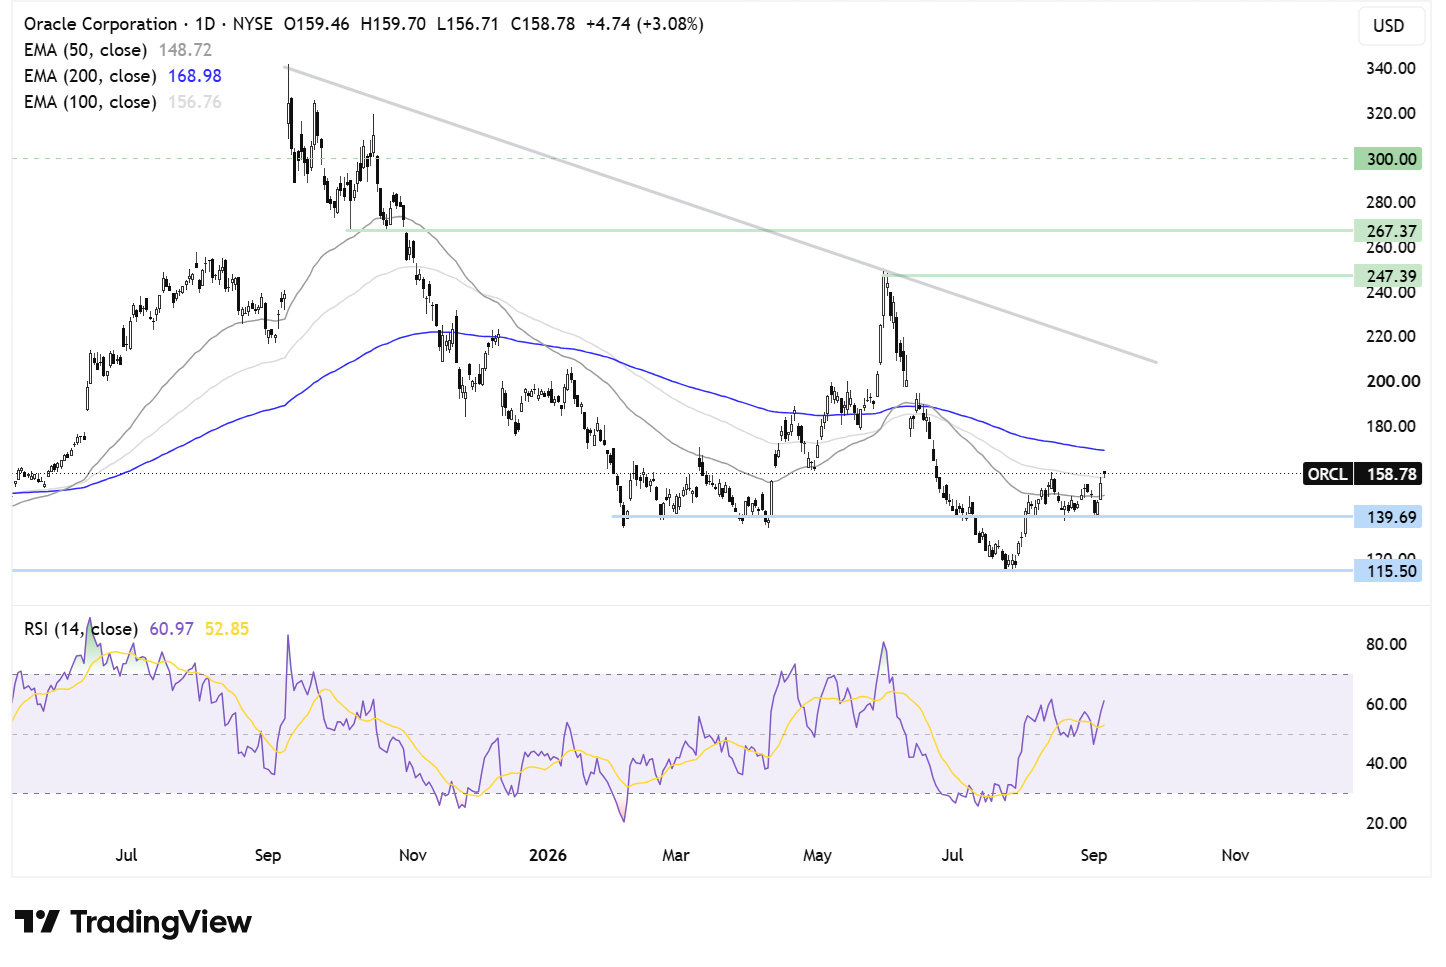
The share price trades below its falling trend line dating back to September last year and below the 200 EMA, keeping the longer-term outlook bearish.
However, in the near term, the price has recovered from the 2026 low of 114, pushing above the 50 EMA. Combined with the RSI above 50, this is keeping buyers hopeful of a more constructive near-term outlook.
Buyers would need to retake the 200 EMA at 170 in order to turn attention to the falling trend line resistance at 214. A rise above 247, the 2026 high, would turn the chart more bullish.
On the downside, immediate support is at the 50 EMA, with a break below here and 140, the September low, turning attention towards 115, the 2026 low. A break below here would extend the bearish decline.
Adobe earnings preview
Adobe is due to release earnings on September 10 after the market close. Expectations are for EPS of $6.09 on revenue of $6.7 billion, versus $5.99 and $5.31 billion a year ago.
The key focus will be AI monetization, as Adobe's Creative freemium monthly active users surpassed 90 million in Q2, up more than 70%. While Firefly ARR approached $300 million, Acrobat and Express MAUs exceeded 850 million, rising 20%.
A stronger conversion of Adobe's rapidly expanding free AI audience into paying customers is what the market would need to see. However, any weakness in Creative seats could reinforce concerns that AI usage growth is not translating quickly enough into recurring revenue.
How to trade ADBE earnings
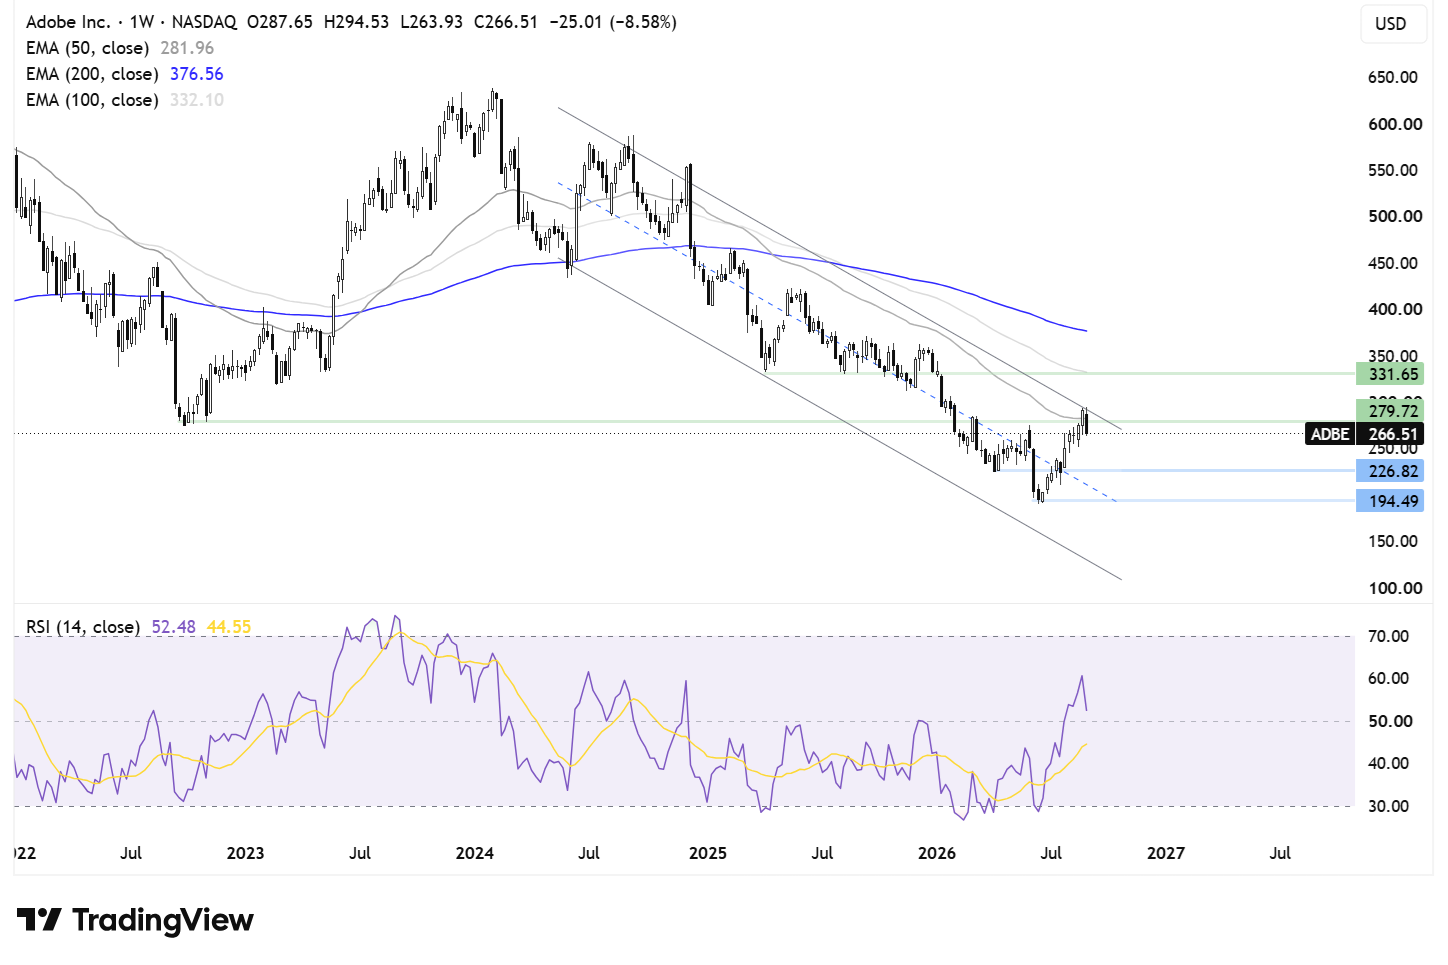
The share price has been trending lower since January 2024, forming a series of lower highs and lower lows before running into support at 191 in June this year. From here, the price has recovered higher, testing the 50 EMA resistance and the upper band of the falling channel.
Buyers will need to rise above 294, the August high, to bring 330 into focus. Horizontal resistance and the 100 EMA rising above here expose the 200 EMA at 375. Above here, the outlook turns more constructive.
On the downside, immediate support can be seen around 223, the March low, with a break below here turning attention to 190, the 2026 low. Sellers will need to take out this level to create a lower low and extend the bearish move.
Macy’s earnings preview
Macy's Q2 earnings are due before the U.S. market opens on Thursday, September 10.
Expectations are for EPS of $0.37 a share, pointing to a 9.8% year-on-year decline, on revenue of $4.82 billion, marking a 0.2% increase compared with the same quarter a year ago.
While Q1 earnings were encouraging, with Macy's reporting $4.68 billion in revenue ahead of the $4.61 billion consensus, while EPS of $0.13 was well ahead of estimates of $0.02, comparable sales and margins could be a more important driver than whether earnings beat by two or three cents.
The data will also provide an insight into whether the U.S. consumer is still willing to spend on discretionary goods. U.S. retail sales fell 0.6% in July, the first decline in nine months, whilst core sales also fell 0.4%, suggesting some cooling in consumer demand going into Macy's Q2 reporting period.
With petrol prices significantly higher than where they were a year ago and inflation sticky, consumers have less disposable income for discretionary purchases such as clothing, furniture and department store merchandise. However, Macy's could be able to benefit from customers trading down from more expensive retailers.
While inflation is sticky, the latest nonfarm payroll report suggested that the jobs market remains resilient, and a consumer with a job and rising wages can continue to spend even if prices are high.
Finally, tariffs will be another area of interest. Macy's said in Q1 that tariffs reduced EPS by approximately 4 cents, and it expects tariffs and fuel costs to reduce Q2 EPS by a further 3 to 4 cents, with a 20-40 bps drop in gross margins.
How to trade M earnings
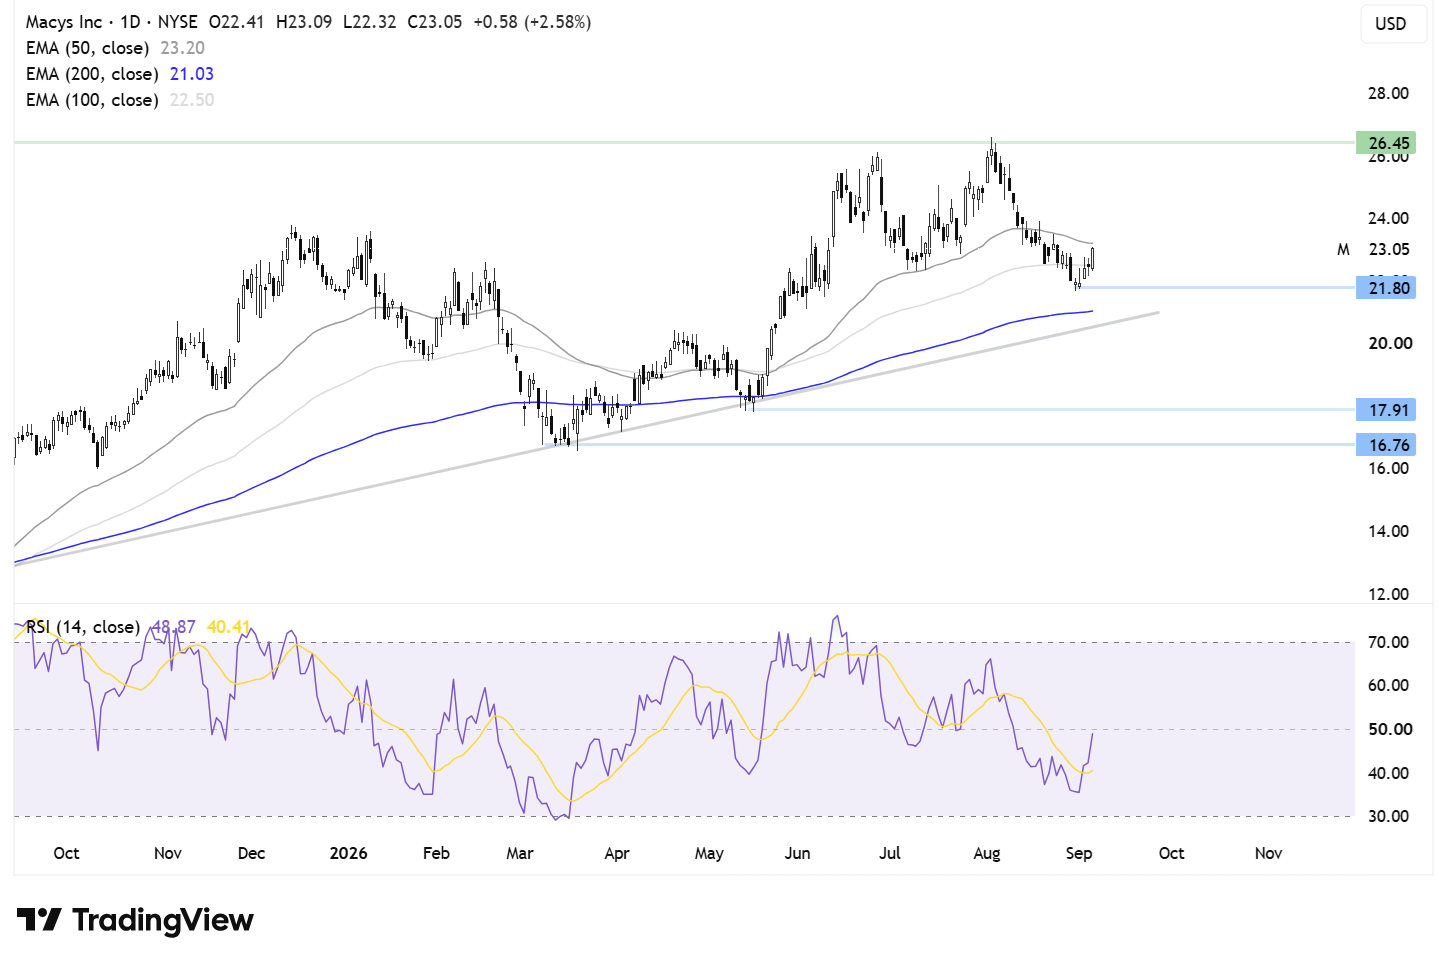
The share price trades above its rising trend line and its 200 EMA. The price has formed a series of higher highs, running into resistance at 2,659 before easing back to find support at 2,175. From here, the price has recovered but continues to trade below the 50 EMA at 2,023.20.
Buyers will need to rise above this level in order to bring 2,650 and fresh record highs back into focus.
On the downside, failure to retake the 50 EMA could see attention turn back to 1,165, the August low, and the 200 EMA right below here could see sellers gain traction towards 1,780, the May low, and 1,670, the 2026 low.
Related tags:



Open an account in minutes
Experience award-winning platforms with fast and secure execution, and enjoy tight spreads from 0.5 pts on FX and 0.3 pts on indices.
Economic calendar
Web Trader platform
Our sophisticated web-based platform is packed with features.
Related articles

Equities Weekly Outlook: PepsiCo, Delta Airlines & Constellation Brands
Earnings this week come from PepsiCo, Delta Airlines & Constellation Brands.

S&P 500, Nasdaq, Dow Forecast: Wall Street Split Widens Into Month-End 9 26 2026
Nasdaq strength contrasts with mounting Dow pressure as rising Treasury yields raise the stakes for stocks heading into the monthly close.


Weekly Equities Outlook: Nike, Micron Technology, Carnival Corp.
Earnings from Nike comes as the share price trades at a 12-year low. Micron Technology keeps the AI trade in focus and Carnival suffers from rising fuel costs.
This report is intended for general circulation only. It should not be construed as a recommendation, or an offer (or solicitation of an offer) to buy or sell any financial products. The information provided does not take into account your specific investment objectives, financial situation or particular needs. Before you act on any recommendation that may be contained in this report, independent advice ought to be sought from a financial adviser regarding the suitability of the investment product, taking into account your specific investment objectives, financial situation or particular needs.
StoneX Financial Pte. Ltd., may distribute reports produced by its respective foreign entities or affiliates within the StoneX group of companies or third parties pursuant to an arrangement under Regulation 32C of the Financial Advisers Regulations. Where the report is distributed to a person in Singapore who is not an accredited investor, expert investor or an institutional investor (as defined in the Securities Futures Act), StoneX Financial Pte. Ltd. accepts legal responsibility to such persons for the contents of the report only to the extent required by law. Singapore recipients should contact StoneX Financial Pte. Ltd. at 6826 9988 for matters arising from, or in connection with the report.
In the case of all other recipients of this report, to the extent permitted by applicable laws and regulations neither StoneX Financial Pte. Ltd. nor its associated companies will be responsible or liable for any loss or damage incurred arising out of, or in connection with, any use of the information contained in this report and all such liability is hereby expressly disclaimed. No representation or warranty is made, express or implied, that the content of this report is complete or accurate.
StoneX Financial Pte. Ltd. is not under any obligation to update this report.
Trading CFDs carries a high level of risk that may not be suitable for some investors. Consider your investment objectives, level of experience, financial resources, risk appetite and other relevant circumstances carefully. The possibility exists that you could lose some or all of your investments, including your initial deposits. If in doubt, please seek independent expert advice. Visit www.forex.com/en-sg/terms-and-policies for the complete Risk Disclosure Statement.