




Yuan bulls do not be complacent after Phase One trade deal
USD/CNH may see a bullish reversal at 6.9700/9400 major support zone.
Share this:

The USD/CNH (offshore Yuan) has witnessed its biggest single day intraday drop of 1023 pips/-1.46% in 3-month since 02 Sep 2019 to print an intraday low of 6.9230 on last Thurs, 12 Dec 2019 after news broke out that U.S and China have agreed to the terms of the “much hyped” Phase One trade deal.
On Friday, 13 Fri both sides have agreed in principal on the Phase One deal and official signed off is expected to take place in Jan 2020. The main crux is U.S. will halt future tariff hikes on Chinese products and halve its 15% tariff on about US$120 billion worth of China imports. In return, China will purchase a significant amount of U.S. agriculture products, commitments on intellectual property and forced technology transfer as well as suspend additional tariffs on vehicles and auto parts from the U.S.
There are several pointers to highlight that last Fri’s event do not guarantee a “finalised solution” to end the 18-month long trade war between two biggest economies and other factors to consider the can reverse the recent gains seen in the Yuan.
- After Phase One, there are still existing U.S tariffs in place on China imports; US$250 billion taxed at 25% and the remaining US$120 billion at a tariff rate of 7.5%. Thus, China based manufacturers are not fully out of the woods from the “trade war trenches”.
- Binding enforcement mechanism towards China on forced technology transfer and market based practises on intellectual property rights that the U.S. Administration has alleged China for malpractices on these aspects. Thus, if U.S. deems that China does not keep her promises, tariffs can easily be imposed back.
- Phase Two will focus on more complex issues such as getting China to curb subsidies to state-owned enterprises (SOE). Funding to SOEs are part of China President Xi’s grand strategic plan in making China a top global hub for high technology products and Chinese hawks have deemed such demand from U.S. as a strategic measure to prevent the economic rise of China that can threaten U.S.’s standing. Therefore, the negotiation process for Phase Two is likely to be more complicated and China may “buy time” until a new administration takes charge after the 2020 U.S. Presidential Election.
- China Central Economic Work Conference last week that crafts out China’s long-term economic growth strategy and determine 2020’s GDP growth target (only to be announced officially in Mar 2020 during the National People’s Congress and Chinese People’s Political Consultative Conference) has just concluded last week and was attended by President Xi. The official Xinhua News Agency has reported, citing a statement that includes; “sources of global turbulence and risk have increased noticeably. We must make contingency plans” and “prudent monetary policy must be flexible and appropriate to ensure reasonably ample liquidity, maintain money, credit and aggregate financing growth in line with economic growth, and lower funding costs.” These statements imply that China is likely to adhere to a lower economic growth target in 2020, down from 6% to 6.5% targeted in 2019 and will not open the “liquidity flood gates” on similar scale seen in 2016 to boost growth.
- Technical analysis suggests that the drop seen in the USD/CNH has reached an important inflection zone where the USD/CNH (offshore Yuan) may see the start of another impulsive up move sequence, Yuan weakness (see details below).
USD/CNH tested major support zone with positive elements
click to enlarge charts
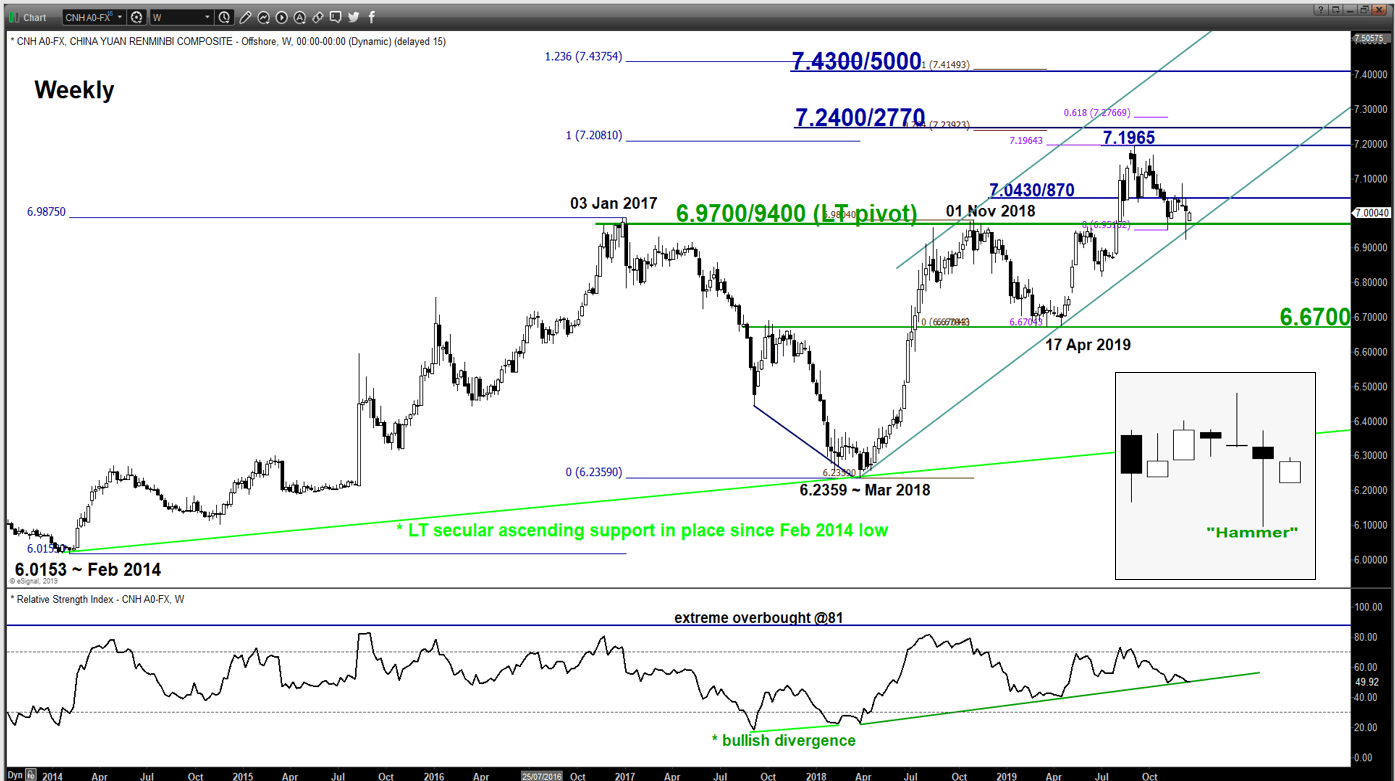
- The USD/CNH has staged a rebound from the major support zone of 6.9700/9400 (no weekly close below 6.9400 after an intraday low of 6.9230 was printed on 12 Dec 2019).
- Positive elements have surfaced with its price action has formed a weekly “Hammer” bullish reversal candlestick pattern right on the 6.9700/9400 major support zone coupled with a bullish divergence signal seen on its daily RSI oscillator at the oversold region. These observations suggest that the downside momentum has started to abate.
- A daily close above 7.0870 is likely to trigger a potential multi-month up move to retest the 7.1965 swing high printed in Sep 2019 in the first step.
The USD/CNH (offshore Yuan) has witnessed its biggest single day intraday drop of 1023 pips/-1.46% in 3-month since 02 Sep 2019 to print an intraday low of 6.9230 on last Thurs, 12 Dec 2019 after news broke out that U.S and China have agreed to the terms of the “much hyped” Phase One trade deal.
On Friday, 13 Fri both sides have agreed in principal on the Phase One deal and official signed off is expected to take place in Jan 2020. The main crux is U.S. will halt future tariff hikes on Chinese products and halve its 15% tariff on about US$120 billion worth of China imports. In return, China will purchase a significant amount of U.S. agriculture products, commitments on intellectual property and forced technology transfer as well as suspend additional tariffs on vehicles and auto parts from the U.S.
There are several pointers to highlight that last Fri’s event do not guarantee a “finalised solution” to end the 18-month long trade war between two biggest economies and other factors to consider the can reverse the recent gains seen in the Yuan.
- After Phase One, there are still existing U.S tariffs in place on China imports; US$250 billion taxed at 25% and the remaining US$120 billion at a tariff rate of 7.5%. Thus, China based manufacturers are not fully out of the woods from the “trade war trenches”.
- Binding enforcement mechanism towards China on forced technology transfer and market based practises on intellectual property rights that the U.S. Administration has alleged China for malpractices on these aspects. Thus, if U.S. deems that China does not keep her promises, tariffs can easily be imposed back.
- Phase Two will focus on more complex issues such as getting China to curb subsidies to state-owned enterprises (SOE). Funding to SOEs are part of China President Xi’s grand strategic plan in making China a top global hub for high technology products and Chinese hawks have deemed such demand from U.S. as a strategic measure to prevent the economic rise of China that can threaten U.S.’s standing. Therefore, the negotiation process for Phase Two is likely to be more complicated and China may “buy time” until a new administration takes charge after the 2020 U.S. Presidential Election.
- China Central Economic Work Conference last week that crafts out China’s long-term economic growth strategy and determine 2020’s GDP growth target (only to be announced officially in Mar 2020 during the National People’s Congress and Chinese People’s Political Consultative Conference) has just concluded last week and was attended by President Xi. The official Xinhua News Agency has reported, citing a statement that includes; “sources of global turbulence and risk have increased noticeably. We must make contingency plans” and “prudent monetary policy must be flexible and appropriate to ensure reasonably ample liquidity, maintain money, credit and aggregate financing growth in line with economic growth, and lower funding costs.” These statements imply that China is likely to adhere to a lower economic growth target in 2020, down from 6% to 6.5% targeted in 2019 and will not open the “liquidity flood gates” on similar scale seen in 2016 to boost growth.
- Technical analysis suggests that the drop seen in the USD/CNH has reached an important inflection zone where the USD/CNH (offshore Yuan) may see the start of another impulsive up move sequence, Yuan weakness (see details below).
USD/CNH tested major support zone with positive elements
click to enlarge charts
- The USD/CNH has staged a rebound from the major support zone of 6.9700/9400 (no weekly close below 6.9400 after an intraday low of 6.9230 was printed on 12 Dec 2019).
- Positive elements have surfaced with its price action has formed a weekly “Hammer” bullish reversal candlestick pattern right on the 6.9700/9400 major support zone coupled with a bullish divergence signal seen on its daily RSI oscillator at the oversold region. These observations suggest that the downside momentum has started to abate.
- A daily close above 7.0870 is likely to trigger a potential multi-month up move to retest the 7.1965 swing high printed in Sep 2019 in the first step.


Open an account in minutes
Experience award-winning platforms with fast and secure execution, and enjoy tight spreads from 0.5 pts on FX and 0.3 pts on indices.
Economic calendar
Web Trader platform
Our sophisticated web-based platform is packed with features.
Related articles
USD/JPY weekly outlook: Quarter turn scrambles rates regime
USD/JPY’s tight relationship with front-end US rates broke down sharply last week, but quarter-turn flows and positioning suggest the disconnect may prove temporary.

USD/CAD forecast: rally could accelerate above June highs at 1.4250
USD/CAD recovered quickly after weaker US jobs data, keeping the bullish trend in focus. A move above the June highs could accelerate the rally as inflation keeps the Fed under pressure.


USD Sets Fresh Yearly High as EUR/USD Drops Dramatically, USD/JPY Stable
Well, it was a week of USD strength that wasn’t entirely pushed by USD/JPY, as a strong sell-off in EUR/USD has pushed the major pair to its most oversold state in a decade.

This report is intended for general circulation only. It should not be construed as a recommendation, or an offer (or solicitation of an offer) to buy or sell any financial products. The information provided does not take into account your specific investment objectives, financial situation or particular needs. Before you act on any recommendation that may be contained in this report, independent advice ought to be sought from a financial adviser regarding the suitability of the investment product, taking into account your specific investment objectives, financial situation or particular needs.
StoneX Financial Pte. Ltd., may distribute reports produced by its respective foreign entities or affiliates within the StoneX group of companies or third parties pursuant to an arrangement under Regulation 32C of the Financial Advisers Regulations. Where the report is distributed to a person in Singapore who is not an accredited investor, expert investor or an institutional investor (as defined in the Securities Futures Act), StoneX Financial Pte. Ltd. accepts legal responsibility to such persons for the contents of the report only to the extent required by law. Singapore recipients should contact StoneX Financial Pte. Ltd. at 6826 9988 for matters arising from, or in connection with the report.
In the case of all other recipients of this report, to the extent permitted by applicable laws and regulations neither StoneX Financial Pte. Ltd. nor its associated companies will be responsible or liable for any loss or damage incurred arising out of, or in connection with, any use of the information contained in this report and all such liability is hereby expressly disclaimed. No representation or warranty is made, express or implied, that the content of this report is complete or accurate.
StoneX Financial Pte. Ltd. is not under any obligation to update this report.
Trading CFDs carries a high level of risk that may not be suitable for some investors. Consider your investment objectives, level of experience, financial resources, risk appetite and other relevant circumstances carefully. The possibility exists that you could lose some or all of your investments, including your initial deposits. If in doubt, please seek independent expert advice. Visit www.forex.com/en-sg/terms-and-policies for the complete Risk Disclosure Statement.