



Coppers HS Top Doesnt Bode Well For Miners Anglo American In Focus
Copper prices are considering a break down from a multi-month head and shoulders top, and Anglo American may be dragged down with it.
Share this:

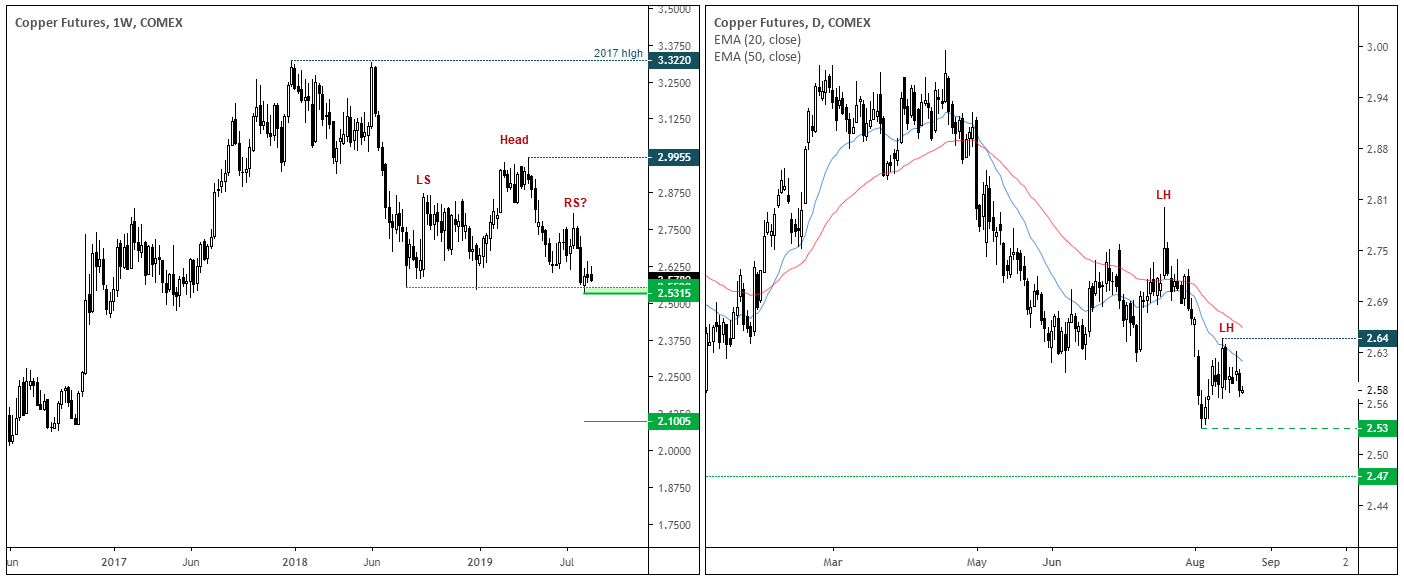
Copper prices have provided a few twists and turns since topping out in 2018. However, price action of the past 1 months appears to be trying to carve out a head and shoulders top pattern. If successful, the pattern projects an approximate target around $2.10 and provides another nail in the coffin of global growth.
Still, the pattern is not perfect (when are they ever) as prices attempted to break support two weeks ago yet remain near recent lows. As this is a weekly chart patience is required, but we would take a break below $2.53 a confirmation of the longer-term reversal.
The daily chart shows that prices have pulled back towards the 20-day eMA, with both the 20 and 50-day eMA’s pointing lower.
- A break above $2.64 warns of a deeper retracement, but bears could consider fading into minor rallies below this key level. This could help improve reward to risk potential.
- Whilst $2.64 holds, we’re looking for prices to head for the $2.53 low and (hopefully) break lower).
- Next support becomes $2.47 but, if the longer-term reversal is to play out, should be temporary.
- Obvious signs of bullish momentum at support levels could provide an argument to exit / step aside.
Weaker copper prices will obviously weigh on copper minders, and one such stock we’re closely watching is Anglo American (FTSE 350). However, classified as a diversified mining company, its three largest commodities are coal, platinum and copper – all of which are under price pressures – and the three account for around 68% of its entire business.
Anglo American: Top 5 Revenue Streams- Coal: 28%
- Platinum: 21%
- Copper: 19%
- Iron Ore: 14%
- Nickel: 6%
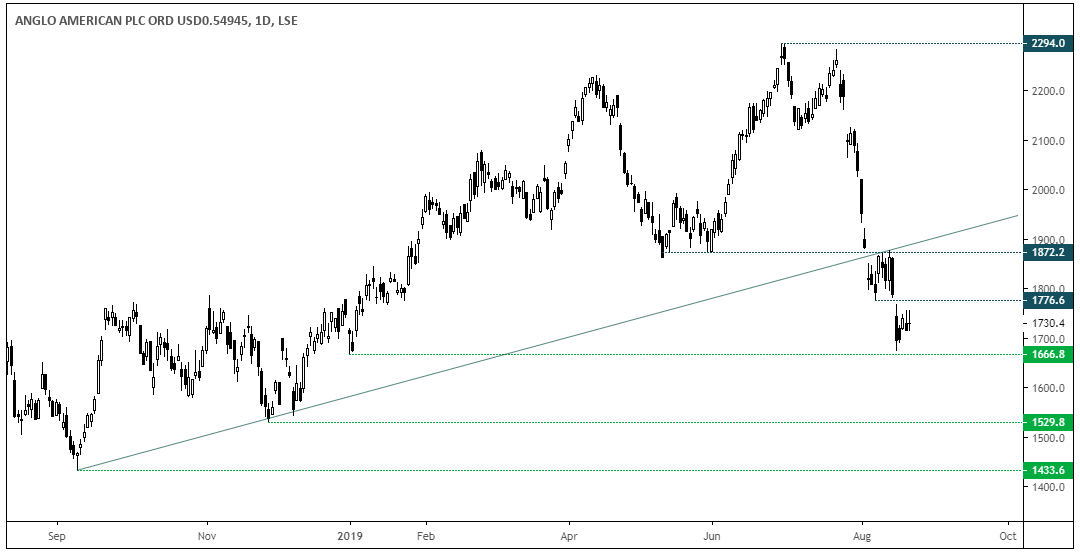
An impulsive move is clear underway, although prices are currently consolidating between 1666 support and 1776 resistance. A break lower in copper could pave the way for further losses, and its downside could be intensified if platinum rolls over and coal remains within its strong downtrend.
- A break below 1666 assumes a run towards 1530 / 1433
- A break above 1776 warns of a deeper retracement and places it on the backburner
Copper prices have provided a few twists and turns since topping out in 2018. However, price action of the past 1 months appears to be trying to carve out a head and shoulders top pattern. If successful, the pattern projects an approximate target around $2.10 and provides another nail in the coffin of global growth.
Still, the pattern is not perfect (when are they ever) as prices attempted to break support two weeks ago yet remain near recent lows. As this is a weekly chart patience is required, but we would take a break below $2.53 a confirmation of the longer-term reversal.
The daily chart shows that prices have pulled back towards the 20-day eMA, with both the 20 and 50-day eMA’s pointing lower.
- A break above $2.64 warns of a deeper retracement, but bears could consider fading into minor rallies below this key level. This could help improve reward to risk potential.
- Whilst $2.64 holds, we’re looking for prices to head for the $2.53 low and (hopefully) break lower).
- Next support becomes $2.47 but, if the longer-term reversal is to play out, should be temporary.
- Obvious signs of bullish momentum at support levels could provide an argument to exit / step aside.
Weaker copper prices will obviously weigh on copper minders, and one such stock we’re closely watching is Anglo American (FTSE 350). However, classified as a diversified mining company, its three largest commodities are coal, platinum and copper – all of which are under price pressures – and the three account for around 68% of its entire business.
Anglo American: Top 5 Revenue Streams- Coal: 28%
- Platinum: 21%
- Copper: 19%
- Iron Ore: 14%
- Nickel: 6%
An impulsive move is clear underway, although prices are currently consolidating between 1666 support and 1776 resistance. A break lower in copper could pave the way for further losses, and its downside could be intensified if platinum rolls over and coal remains within its strong downtrend.
- A break below 1666 assumes a run towards 1530 / 1433
- A break above 1776 warns of a deeper retracement and places it on the backburner
Related tags:



Open an account in minutes
Experience award-winning platforms with fast and secure execution.
Economic calendar
Web Trader platform
Our sophisticated web-based platform is packed with features.
Related articles
China's steel slump leaves iron ore bulls under the pump
Iron ore has broken major support, threatening a return to the lows of 2022 as mounting evidence of weakness in China's steel sector reinforces the bearish outlook.

DXY, GBP/USD, AUD/USD, USD/CAD, USD/JPY, Gold Weekly Technical Outlook 11 16 2026
Sr. Technical Strategist Michael Boutros highlights the levels that matter on the USD Majors, commodities, and equity indices charts this week.


Tankers Still Get Hit but Brent Crude Oil Keeps Falling
Brent crude oil has turned bearish after breaking its uptrend, as de-escalation signals outweigh tanker strikes near the Strait of Hormuz.

StoneX Financial Ltd (trading as "FOREX.com") is an execution-only service provider. This material, whether or not it states any opinions, is for general information purposes only and it does not take into account your personal circumstances or objectives. This material has been prepared using the thoughts and opinions of the author and these may change. However, FOREX.com does not plan to provide further updates to any material once published and it is not under any obligation to keep this material up to date.
This material is short term in nature and may only relate to facts and circumstances existing at a specific time or day. Nothing in this material is (or should be considered to be) financial, investment, legal, tax or other advice and no reliance should be placed on it. No opinion given in this material constitutes a recommendation by FOREX.com or the author that any particular investment, security, transaction or investment strategy is suitable for any specific person.
The material has not been prepared in accordance with legal requirements designed to promote the independence of investment research. Although FOREX.com is not specifically prevented from dealing before providing this material, FOREX.com does not seek to take advantage of the material prior to its dissemination. This material is not intended for distribution to, or use by, any person in any country or jurisdiction where such distribution or use would be contrary to local law or regulation. For further details see our full non-independent research disclaimer and quarterly summary.