



ASX 200 Outlook: Tech Stocks Surge as Traders Eye Dips
ASX 200 slips below 9000 as tech stocks surge, with traders likely to buy dips despite near-term consolidation risks.
Share this:

The ASX 200 is hovering just below 9000, with price action showing signs of fatigue near the highs. But beneath the surface, strength in the tech sector suggests this remains a market where traders are likely to buy dips, even as a short-term pullback or consolidation unfolds.
View related analysis:
View related analysis:
ASX 200 Forecast: Tech Strength Meets Resistance Near 9000
ASX 200 Market Snapshot
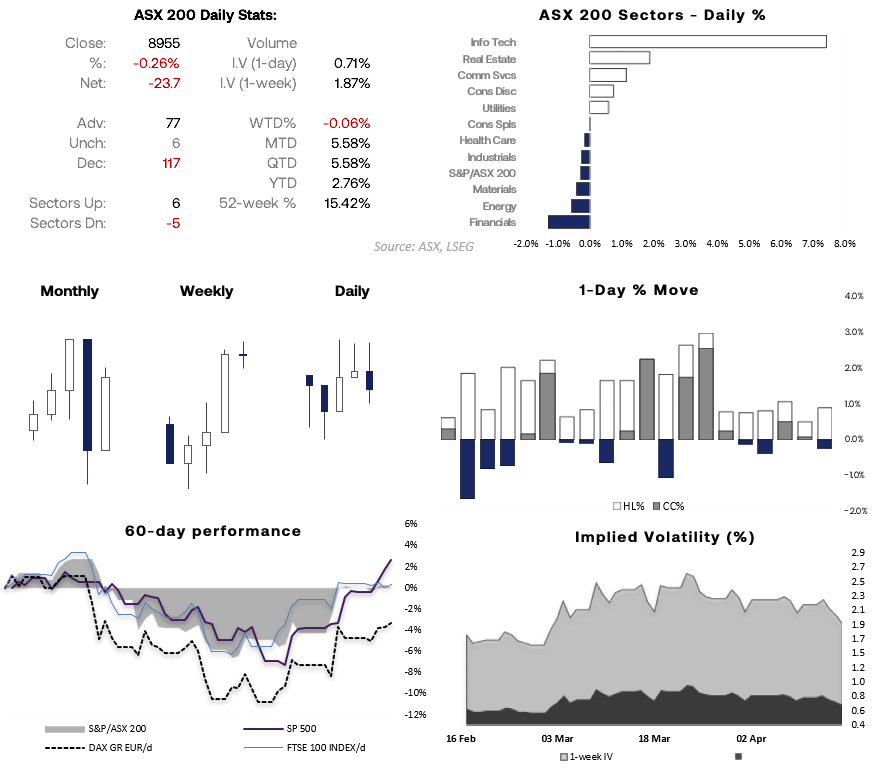
- The Information technology Sector (XIJ) was the clear leader of the five ASX sectors that advanced on Thursday, providing further evidence of an important bottom for the sector
- 6 of the 11 ASX sectors declined, led by Financials (XFJ) and Energy (XEJ)
- Implied volatility has continued to trend lower amid a risk-on tone for global stock markets
- Implied volatility for today is 0.7% according to the 30-day implied volatility index for the S&P ASX 200 VIX (XVI)
- The ASX 20 cash market formed a bearish outside day, following Wednesday’s small shooting star reversal – warning of the potential for a consolidation or minor pullback
Source: ASX, LSEG


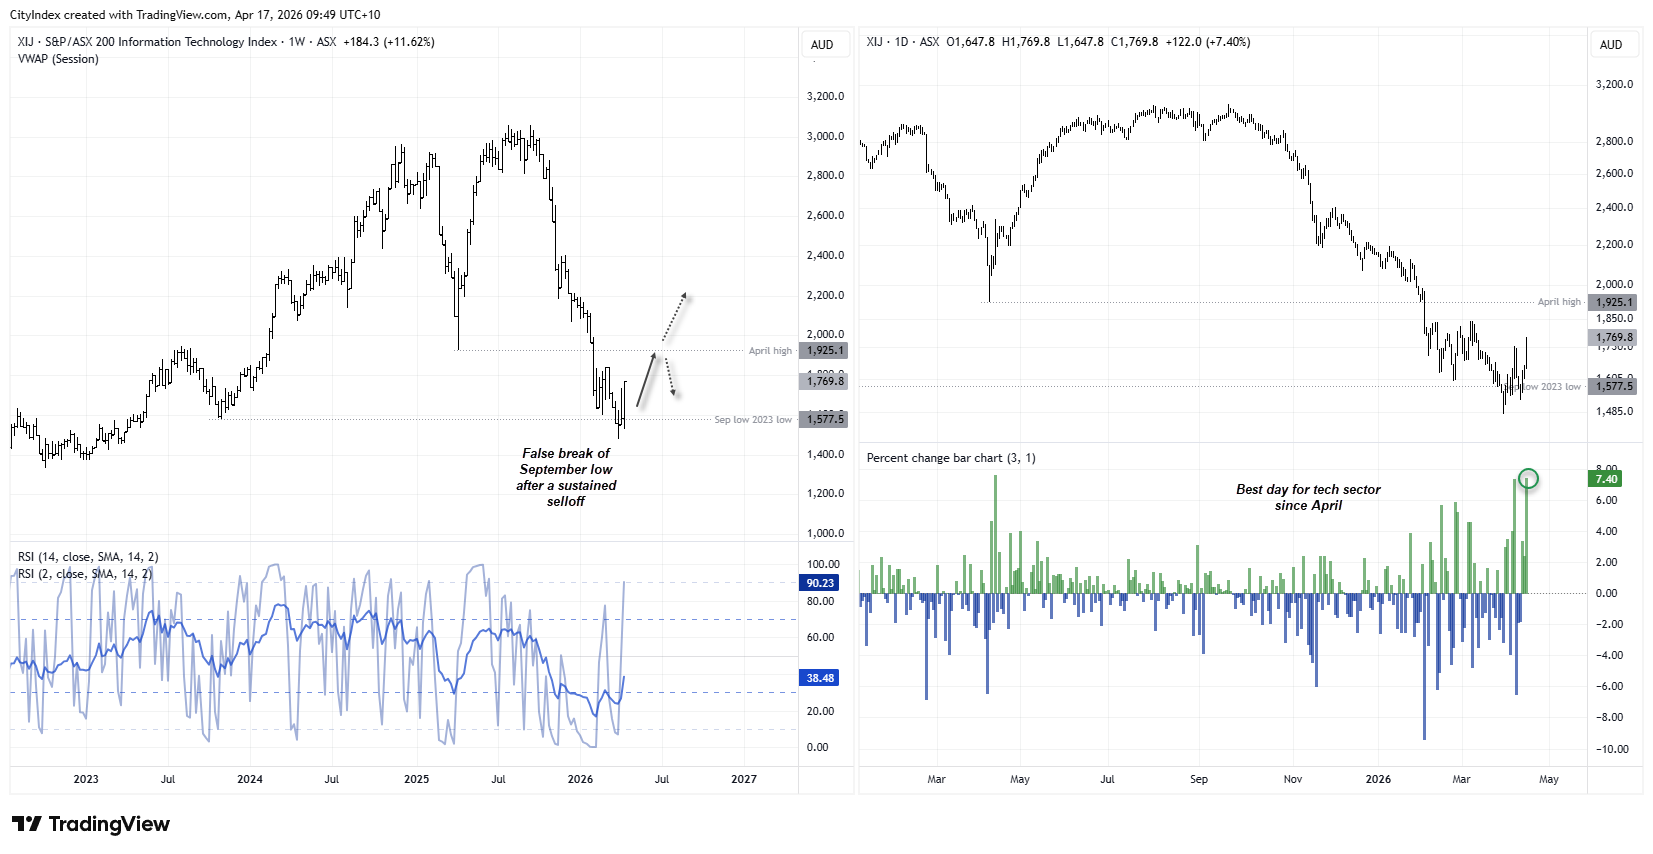
ASX Technology (XIJ) Rebound Gains Traction Above Key Support
ASX Information Technology (XIJ) shows early signs of stabilisation after a sharp selloff, with a false break below key support hinting at buyer interest. While the ASX tech sector is attempting a rebound, the broader trend remains bearish, and further upside confirmation is needed above the April highs to signal a sustained recovery in Australian technology stocks.
Source: ASX, LSEG
ASX 200 Technical Analysis
Bearish Signals Emerge Near Highs Despite Resilient Futures
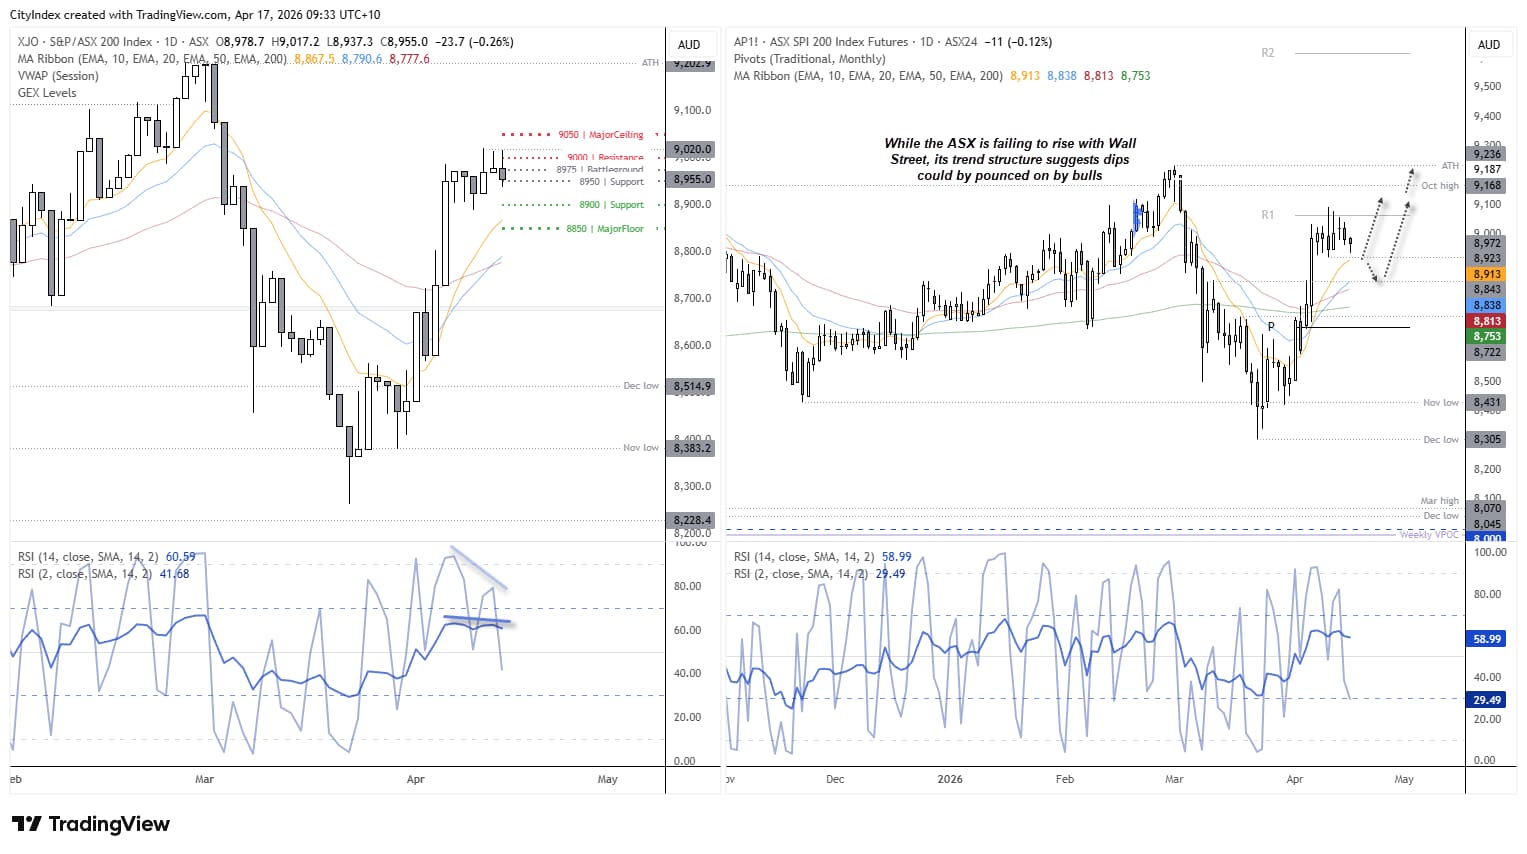
The daily ASX cash market chart (left) shows a bearish outside day formed near the cycle highs. In fact, there appears to be a triple top around 9,020. With bearish divergence on both RSI (2) and RSI (14), a minor pullback could be due.
Meanwhile, the SPI 200 (ASX 200 futures) chart shows prices holding up overnight, refusing to fall but also failing to keep pace with Wall Street’s rally. If the market cannot rise on positive cues, it strengthens the case for at least a near-term pullback.
Even so, bulls may look to buy dips towards the 10 or 20-day EMAs, with a view to a late rally that closes the gap with Wall Street. That could bring the all-time high back into focus over the coming week or two.
Source: ASX, ASX24, TradingView
Options Positioning Points to Tight Range With 9000 as Key Pivot
Options positioning shows the ASX 200 is trading within a tighter, more actionable range. The 8975–8950 area is a key battleground, where price may chop and rotate. Above, 9000–9050 is the resistance zone, where rallies are likely to slow. On the downside, 8900–8850 provides support, where buyers may step in if price pulls back.
In a nutshell: I expect range-bound trading, with chop around 8950–8975, resistance overhead near 9000, and support building below 8900.
View the full economic calendar
View the full economic calendar
-- Written by Matt Simpson
Follow Matt on Twitter @cLeverEdge
How to trade with City Index
You can trade with City Index by following these four easy steps:
- Open an account, or log in if you’re already a customer
• Open an account in the UK
• Open an account in Australia
• Open an account in Singapore
- Search for the market you want to trade in our award-winning platform
- Choose your position and size, and your stop and limit levels
- Place the trade
Related tags:



Open an account in minutes
Experience award-winning platforms with fast and secure execution.
Economic calendar
Web Trader platform
Our sophisticated web-based platform is packed with features.
Related articles
China's steel slump leaves iron ore bulls under the pump
Iron ore has broken major support, threatening a return to the lows of 2022 as mounting evidence of weakness in China's steel sector reinforces the bearish outlook.

USD/JPY, AUD/JPY: Central Bank Divergence Creates Two-Way Risk
USD/JPY eyes a breakout above 160, while AUD/JPY faces further losses as Fed, RBA and BoJ interest rate expectations diverge.

Gold and silver forecast: Precious metals extend drop but seasonality hopes keeps bullish case alive
It has been a risk off session so far today with stocks, gold and especially silver (-4%) all taking a drop. Gold has fallen to a fresh 2026 low and its now more than $100 below the psychologically important $4,000 mark. A firmer US dollar, rising US rate expectations and fading safe-haven demand have combined to undermine the metal, despite continued central bank buying. This year has so far been a bad one for gold.

StoneX Financial Ltd (trading as "FOREX.com") is an execution-only service provider. This material, whether or not it states any opinions, is for general information purposes only and it does not take into account your personal circumstances or objectives. This material has been prepared using the thoughts and opinions of the author and these may change. However, FOREX.com does not plan to provide further updates to any material once published and it is not under any obligation to keep this material up to date.
This material is short term in nature and may only relate to facts and circumstances existing at a specific time or day. Nothing in this material is (or should be considered to be) financial, investment, legal, tax or other advice and no reliance should be placed on it. No opinion given in this material constitutes a recommendation by FOREX.com or the author that any particular investment, security, transaction or investment strategy is suitable for any specific person.
The material has not been prepared in accordance with legal requirements designed to promote the independence of investment research. Although FOREX.com is not specifically prevented from dealing before providing this material, FOREX.com does not seek to take advantage of the material prior to its dissemination. This material is not intended for distribution to, or use by, any person in any country or jurisdiction where such distribution or use would be contrary to local law or regulation. For further details see our full non-independent research disclaimer and quarterly summary.