
Over the last five trading sessions, Bitcoin has posted a consistent gain of more than 7.00%, allowing a clear bullish bias to re-emerge in the market, something that had not been seen with this strength in recent weeks. In addition, the price has managed to move above the key psychological level of $80,000 in the short term, marking an important shift in the recent market structure.
The buying pressure that has started to build is largely driven by regulatory developments in the United States, particularly the progress of the Clarity Act, which has managed to overcome key legislative hurdles. This event has generated a renewed sense of optimism in the short term, boosting activity around Bitcoin. In this context, if further positive updates emerge, the current buying momentum could remain relevant in the coming sessions.

Is crypto regulation moving forward?
In recent sessions, the US Senate released the compromise text of the Clarity Act, showing meaningful progress after months of negotiations between the crypto industry and the banking sector. The proposal now enters a review phase within the Senate Banking Committee, marking a key step toward potential approval.
This development is important because it could move the crypto market out of a regulatory gray area and into a more clearly defined asset class, potentially attracting greater institutional participation. This, in turn, could open the door to new financial products and broader ecosystem development, reducing regulatory uncertainty and bringing the market closer to traditional financial structures.
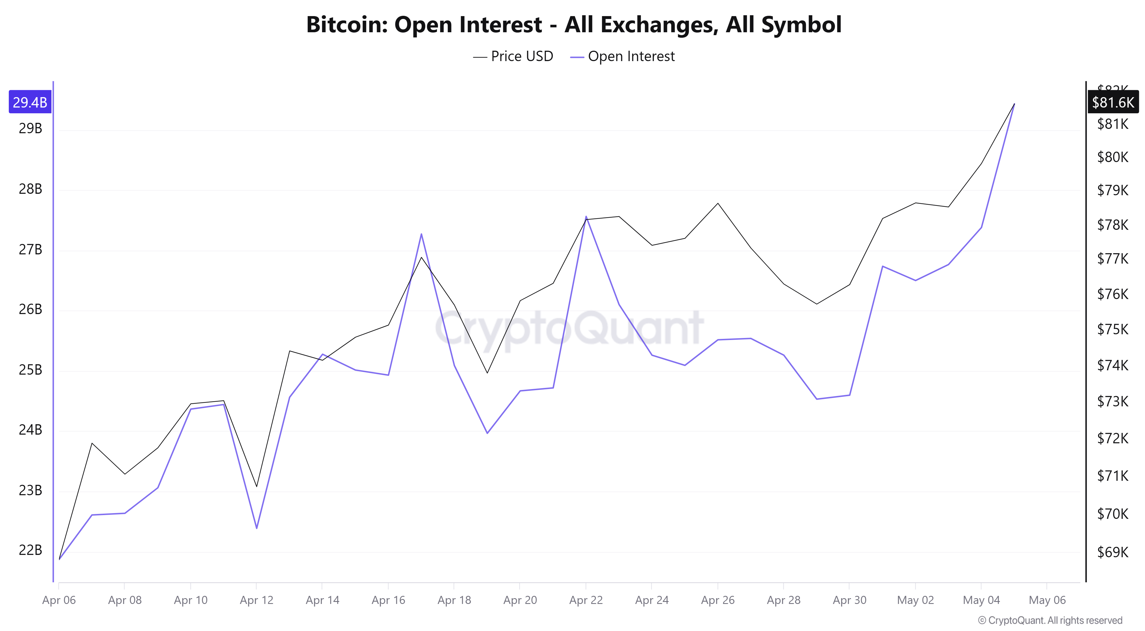
In the short term, these expectations have already begun to improve sentiment around Bitcoin, as clearer regulation strengthens the outlook for future demand. This is reflected in on-chain metrics such as Open Interest, which has shown steady growth, approaching the $30 billion level in open positions.
This increase, combined with the recent price rally, suggests that new long positions are entering the market, reflecting stronger confidence and demand activity in the short term.
Source: CryptoQuant
Taking all of this into account, the recent rally in Bitcoin may be closely tied to these regulatory developments. As more updates emerge, market confidence could continue to improve, supporting further upside pressure.
However, it is also important to consider that Bitcoin remains exposed to broader macroeconomic factors. Events such as a potential resurgence in global inflation could weigh on overall market sentiment and quickly erode the optimism seen in recent sessions, bringing selling pressure back into the market.
Confidence shows slight improvement
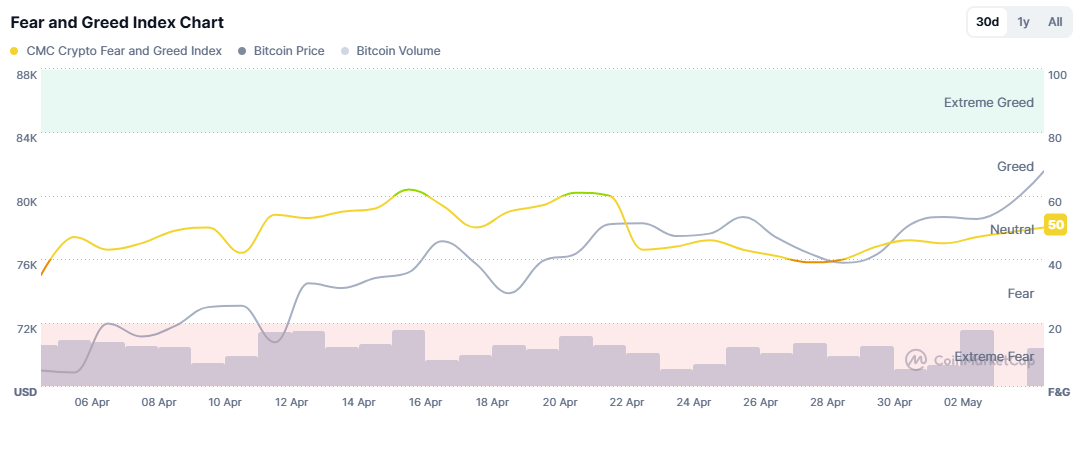
At present, the crypto market sentiment indicator—the Fear and Greed Index—has started to show a modest recovery, moving closer to the 50 level and entering neutral territory, gradually moving away from the “fear” zone.
This suggests that market sentiment has begun to stabilize in recent sessions, reflecting a more balanced environment.
Source: Coinmarketcap
This behavior indicates that the market may be regaining some of its lost optimism, and if this trend continues, it could create more favorable conditions for demand to develop in the short term. In this context, a sustained improvement in sentiment could continue to support buying pressure in Bitcoin price action in the coming sessions.
Technical outlook for Bitcoin
Source: StoneX, Tradingview
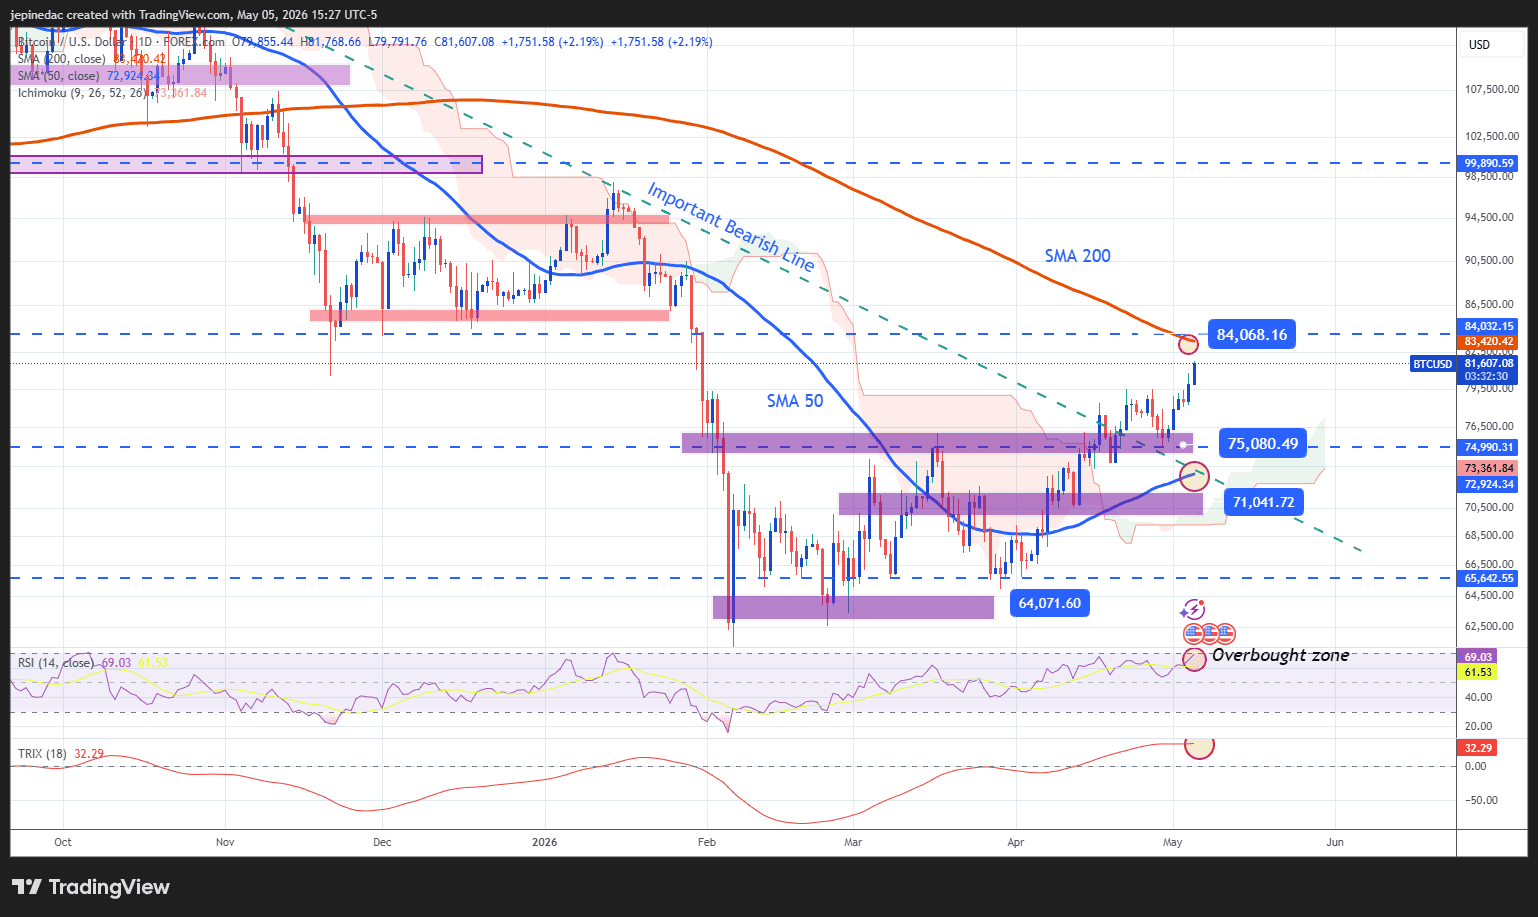
- Long-term trendline loses relevance: For several months, the dominant technical structure in Bitcoin was a bearish trendline that shaped much of the price action. However, in recent sessions, a meaningful breakout of this structure has occurred, driven by renewed buying strength. This technical event is particularly important, as it may signal a broader structural shift, from a market dominated by selling pressure to one where a more sustained bullish bias begins to emerge.
- TRIX: At present, the TRIX indicator remains above the zero level, indicating that the strength of long-term exponential moving averages is still in bullish territory. As long as the indicator maintains an upward slope, it could continue to support buying momentum in the short term.
- RSI: The RSI shows a similar pattern, remaining above the 50 level and confirming the presence of bullish momentum. However, it is now approaching the 70 level, which marks overbought conditions. This could signal a potential overextension in price action, leaving room for short-term corrective moves.
Key levels:
- 84,000 – Key resistance: A zone of recent highs aligned with the 200-period moving average. Moves toward this level could reinforce the bullish bias and, if broken with strength, open the door to a more extended upside move in the short term.
- 75,000 – Near-term barrier: A recent reference level that has acted as a retracement zone. This area could serve as a key support level in the event of short-term corrections.
- 71,000 – Key support: A level below the 50-period moving average that represents the main downside barrier. A move back toward this area could reactivate selling pressure and challenge the recent structural shift, bringing a bearish bias back into focus.
Written by Julian Pineda, CFA, CMT – Market Analyst
Follow him on: @julianpineda25