



Bottom Drops Out for US Stocks
Oh, how quickly the trading tables can turn!
Share this:

Oh, how quickly the trading tables can turn!
It seems like just yesterday that we writing about how it was “All Systems Go” for the S&P 500 heading into earnings season (in actuality, it was just last week). While we had softened our tone as the price action deteriorated (see here and here for examples), the ferocity of today’s selloff is something that few traders saw coming.
As of writing, the widely-followed Dow Jones Industrial Average is falling by more than 600 points to trade back below 26,000, while the S&P sheds nearly 70 points and the Nasdaq is trading off by a full 200 points. All three major US indices are down more than 2% on the day. The DJIA is on track for its fifth-straight bearish day, which would mark the longest losing streak since November 2016.
The proximate catalyst for today’s brutal selloff is difficult to pin down, though some commentators have pointed to the continued march higher in bond yields, signaling rising borrowing costs and an increasingly attractive investment alternative to equities. Interestingly, this has not resulted in a classic “risk off” trading environment, as gold is trading essentially flat on the day and safe haven currencies like the yen, Swiss franc, and US dollar are trading mixed.
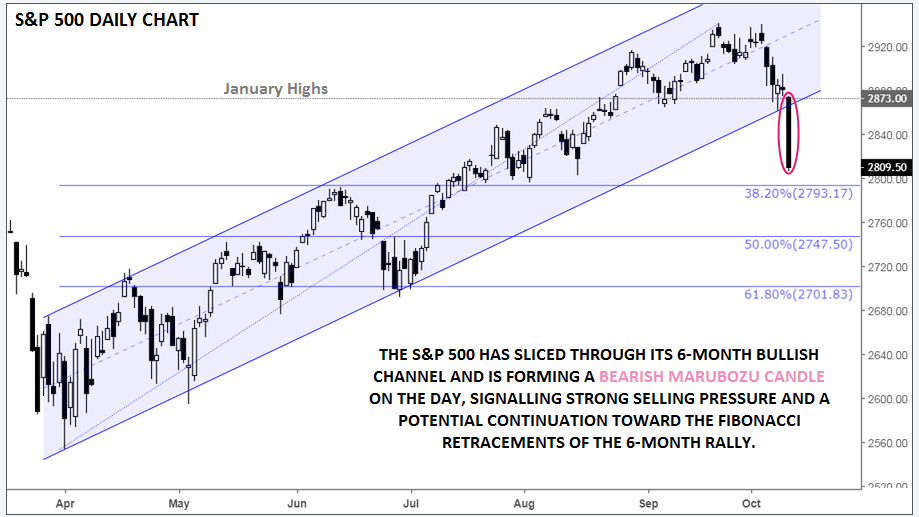
Regardless of the fundamental explanation, it’s clear that we’re seeing significant technical damage on both an individual stock and broader index basis today. The S&P 500 is putting the finishing touches on a large “bearish marubozu” candle, signaling strong selling pressure throughout the day and suggesting we could see a bearish continuation in the coming days. The index has clearly broken its bullish channel off the April lows, opening the door for a deeper drop toward the Fibonacci retracements of the 6-month rally at 2793 (38.2%), 2748 (50%), and 2702 (61.8%).
Source: TradingView, FOREX.com
Related tags:
Latest market news




Open an account in minutes
Experience award-winning platforms with fast and secure execution.
Economic calendar
Web Trader platform
Our sophisticated web-based platform is packed with features.
Related articles
DXY, GBP/USD, AUD/USD, USD/CAD, USD/JPY, Gold Weekly Technical Outlook 11 16 2026
Sr. Technical Strategist Michael Boutros highlights the levels that matter on the USD Majors, commodities, and equity indices charts this week.
S&P, Nasdaq Slide as NVDA, AI Worries Continue to Build
It was a busy weekend in the headlines as a campaign to bring back Jensen Huang atop NVDA gained steam, even with accusations of possible treason and a circular funding model that has started to raise questions.


Crude Oil Weekly Outlook: Geopolitics vs Oversupply Risks
Crude Oil Weekly Outlook: The IEA has flagged the risk of an oil supply surplus since the Iran war began. Yet WTI and Brent have held onto bullish rebounds from key support near 84 and 89, respectively, as geopolitical risks persist.

StoneX Financial Ltd (trading as "FOREX.com") is an execution-only service provider. This material, whether or not it states any opinions, is for general information purposes only and it does not take into account your personal circumstances or objectives. This material has been prepared using the thoughts and opinions of the author and these may change. However, FOREX.com does not plan to provide further updates to any material once published and it is not under any obligation to keep this material up to date.
This material is short term in nature and may only relate to facts and circumstances existing at a specific time or day. Nothing in this material is (or should be considered to be) financial, investment, legal, tax or other advice and no reliance should be placed on it. No opinion given in this material constitutes a recommendation by FOREX.com or the author that any particular investment, security, transaction or investment strategy is suitable for any specific person.
The material has not been prepared in accordance with legal requirements designed to promote the independence of investment research. Although FOREX.com is not specifically prevented from dealing before providing this material, FOREX.com does not seek to take advantage of the material prior to its dissemination. This material is not intended for distribution to, or use by, any person in any country or jurisdiction where such distribution or use would be contrary to local law or regulation. For further details see our full non-independent research disclaimer and quarterly summary.