






Can Microsoft earnings revive the bulls
Microsoft at risk of shaping a multi-week corrective decline as earnings release looms.
Share this:

After the U.S. stock market closes today, bellwether index component stock; Microsoft Corp will report its Q1 2020 earnings where it is ranked first and second in terms of market capitalisation in the S&P 500 and Nasdaq 100 respectively. My colleague, Ken Odeluga has written an earnings preview report on Microsoft and other major U.S. technology firms (click here for a recap).
Let’s us now take a look at the share price of Microsoft from a technical analysis perspective.
Medium-term technical outlook of Microsoft (MSFT)
click to enlarge charts
Key Levels (1 to 3 weeks)
Pivot (key resistance): 142.37
Supports: 130.95 & 116.18/112.45
Next resistance: 152.40/154.40
Directional Bias (1 to 3 weeks)
At risk of shaping a multi-week corrective decline within a longer-term primary uptrend below its current all-time high of 142.37 and a break below 130.95 (trigger level) reinforces a further potential down move to target the next medium-term support zone at 116.18/112.45.
On the other hand, a clearance with a daily close above 142.37 invalidates the corrective decline scenario for a continuation of the impulsive upleg sequence towards the next resistance zone of 152.40/156.40 (upper boundary of long-term primary ascending channel from 24 Aug 2015 low & Fibonacci expansion cluster).
Key elements
- MSFT has broken below a major ascending channel support in place since 24 Dec 2018 low of 93.96 on 01 Oct 2019 and drifted down lower to print a low of 133.22 on 03 Oct 2019. Thereafter, it staged a rebound of 6.4% to retest the pull-back resistance of the former ascending channel support as well as the 142.37 current all-time time level on 15 Oct 2019 where it printed an intraday high of 141.79.
- Thereafter, it has shed -3.9% to print a low of 136.26 in yesterday, 22 Oct U.S. session with upside momentum that has continued to wane. The daily RSI oscillator has posted a bearish divergence signal in place since 24 Jun 2019 while price action of MSFT traced out “similar highs”.
- The 130.95 downside trigger level is defined by the 05 Aug 2019 swing low area (the lowest point of the sideways range formed from 05 Aug to 15 Oct 2019) and the 23.6% Fibonacci retracement of the up move from 24 Dec 2018 low to 19 Sep 2019 current all-time high.
- The significant medium-term support zone of 116.18/112.45 is defined by the 61.8% Fibonacci retracement of the up move from 24 Dec 2018 low to 19 Sep 2019 current all-time high and the lower boundary of the long-term primary ascending channel from 24 Aug 2015 low).
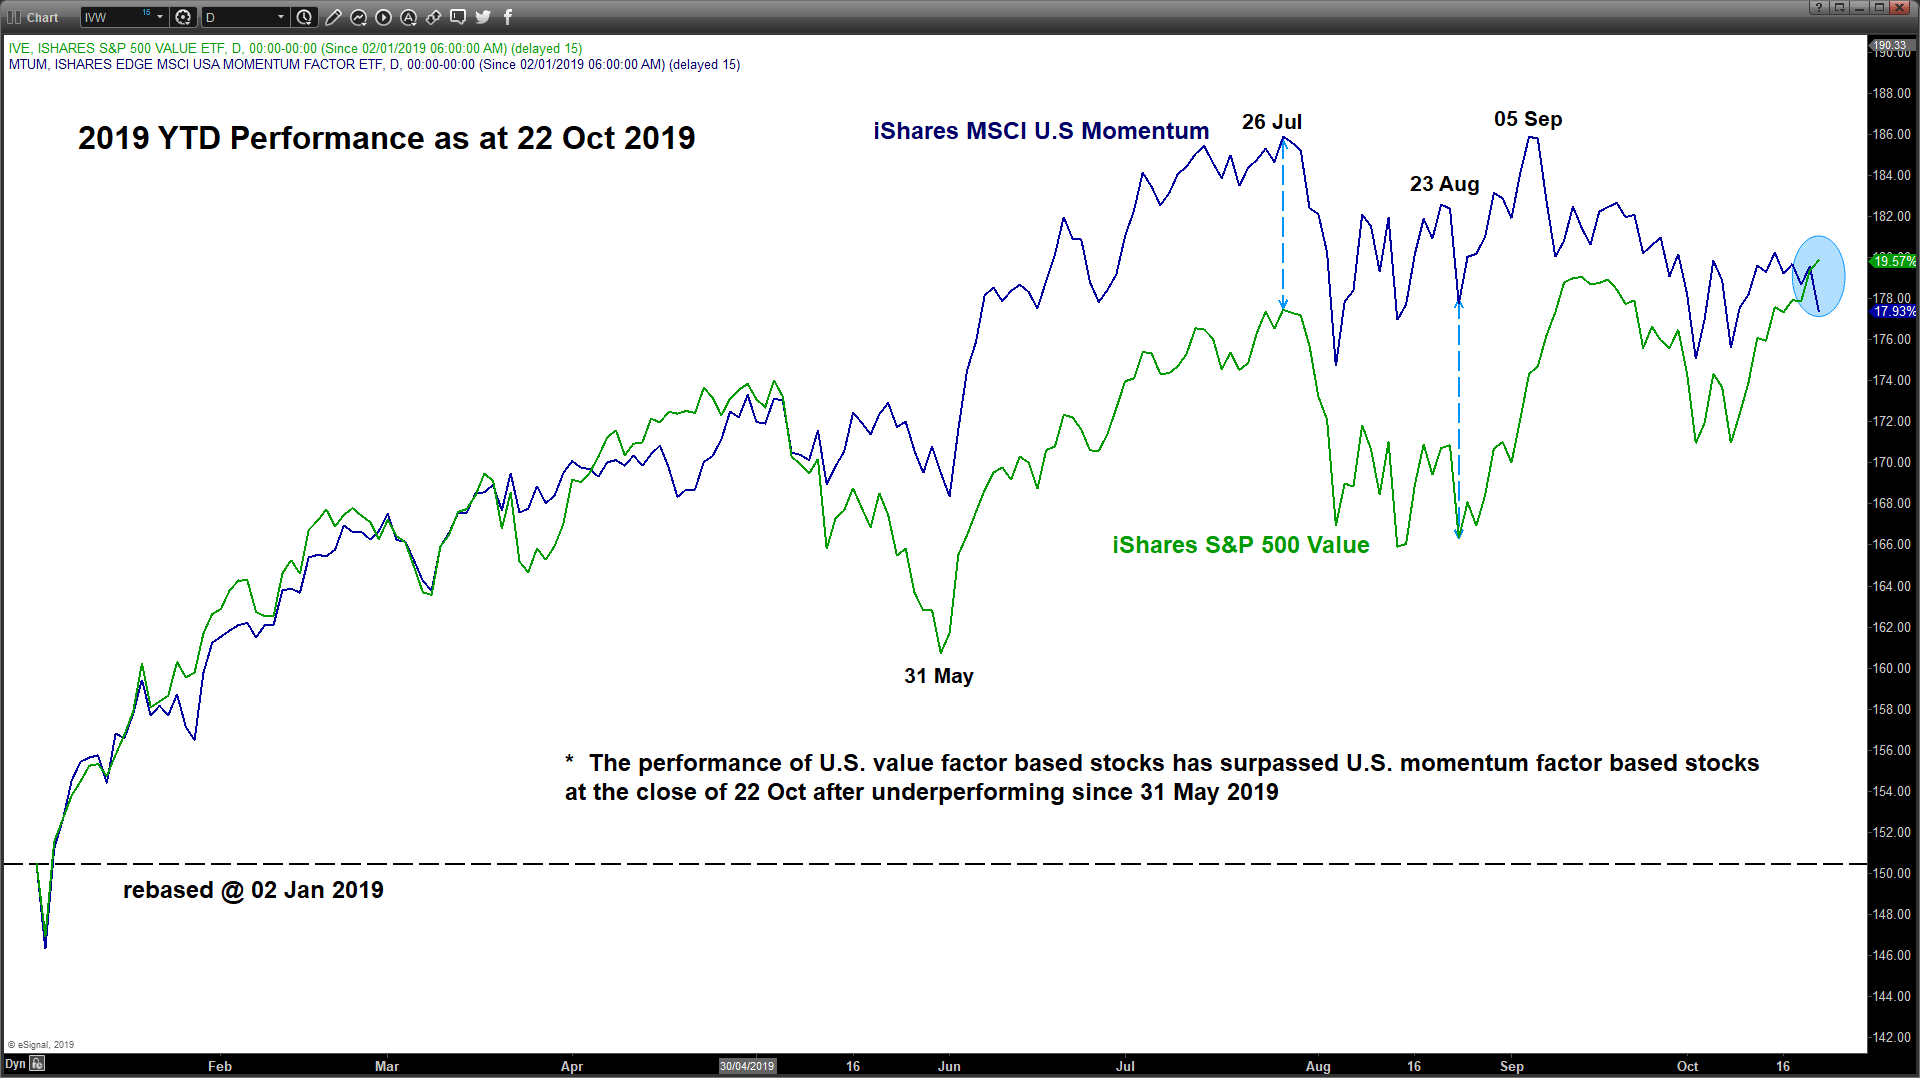
- After the close of yesterday U.S. session based on iShares indices ETFs, value factor-based U.S. stocks (IVE) have outperformed momentum factor-based U.S. stocks (MTUM) for the first time since 31 May 2019 after considering their respective 2019 year to date performances. Microsoft Corp is the 3rd largest component stock in the MSCI USA Momentum Factor Index ETF (MTUM) where a further potential decline in MSFT may see a further widening of outperformance in IVE against MTUM (refer to the last chart).
- Thus, there seems to a significant rotation into value-oriented stocks such as financials, consumer staples and even energy related stocks where these previous laggards may take up a leadership role in the U.S. stock market over the medium-term.
Charts are from eSignal
After the U.S. stock market closes today, bellwether index component stock; Microsoft Corp will report its Q1 2020 earnings where it is ranked first and second in terms of market capitalisation in the S&P 500 and Nasdaq 100 respectively. My colleague, Ken Odeluga has written an earnings preview report on Microsoft and other major U.S. technology firms (click here for a recap).
Let’s us now take a look at the share price of Microsoft from a technical analysis perspective.
Medium-term technical outlook of Microsoft (MSFT)
click to enlarge charts
Key Levels (1 to 3 weeks)
Pivot (key resistance): 142.37
Supports: 130.95 & 116.18/112.45
Next resistance: 152.40/154.40
Directional Bias (1 to 3 weeks)
At risk of shaping a multi-week corrective decline within a longer-term primary uptrend below its current all-time high of 142.37 and a break below 130.95 (trigger level) reinforces a further potential down move to target the next medium-term support zone at 116.18/112.45.
On the other hand, a clearance with a daily close above 142.37 invalidates the corrective decline scenario for a continuation of the impulsive upleg sequence towards the next resistance zone of 152.40/156.40 (upper boundary of long-term primary ascending channel from 24 Aug 2015 low & Fibonacci expansion cluster).
Key elements
- MSFT has broken below a major ascending channel support in place since 24 Dec 2018 low of 93.96 on 01 Oct 2019 and drifted down lower to print a low of 133.22 on 03 Oct 2019. Thereafter, it staged a rebound of 6.4% to retest the pull-back resistance of the former ascending channel support as well as the 142.37 current all-time time level on 15 Oct 2019 where it printed an intraday high of 141.79.
- Thereafter, it has shed -3.9% to print a low of 136.26 in yesterday, 22 Oct U.S. session with upside momentum that has continued to wane. The daily RSI oscillator has posted a bearish divergence signal in place since 24 Jun 2019 while price action of MSFT traced out “similar highs”.
- The 130.95 downside trigger level is defined by the 05 Aug 2019 swing low area (the lowest point of the sideways range formed from 05 Aug to 15 Oct 2019) and the 23.6% Fibonacci retracement of the up move from 24 Dec 2018 low to 19 Sep 2019 current all-time high.
- The significant medium-term support zone of 116.18/112.45 is defined by the 61.8% Fibonacci retracement of the up move from 24 Dec 2018 low to 19 Sep 2019 current all-time high and the lower boundary of the long-term primary ascending channel from 24 Aug 2015 low).
- After the close of yesterday U.S. session based on iShares indices ETFs, value factor-based U.S. stocks (IVE) have outperformed momentum factor-based U.S. stocks (MTUM) for the first time since 31 May 2019 after considering their respective 2019 year to date performances. Microsoft Corp is the 3rd largest component stock in the MSCI USA Momentum Factor Index ETF (MTUM) where a further potential decline in MSFT may see a further widening of outperformance in IVE against MTUM (refer to the last chart).
- Thus, there seems to a significant rotation into value-oriented stocks such as financials, consumer staples and even energy related stocks where these previous laggards may take up a leadership role in the U.S. stock market over the medium-term.
Charts are from eSignal
Related tags:
Latest market news




Open an account in minutes
Experience award-winning platforms with fast and secure execution.
Economic calendar
Web Trader platform
Our sophisticated web-based platform is packed with features.
Related articles

S&P 500, Nasdaq 100 Claw Back But NVDA Cloud Looms Overhead
Last week was green for both the Nasdaq and S&P 500 but given the sell-off that led into that bounce there’s still a very real question as to whether bears still have a statement to make. And the NVDA situation presents a very real threat.


Nasdaq Rips, 8% Off the Lows – Are Bulls Back in Control?
The AI trade is getting a push this morning following the earnings results from Coreweave, and with the Nasdaq already up more than 8% from last week’s lows the big question is whether a low is in place.

S&P 500 Update: SPX Records Its Biggest Selloff of the Year Ahead of NFP
The trading week has not been particularly favorable for risk appetite in the short term, and this is now becoming increasingly evident in the performance of the S&P 500. During today's session, the index is down nearly 4.2%, marking its largest intraday decline of 2026.

StoneX Financial Ltd (trading as "FOREX.com") is an execution-only service provider. This material, whether or not it states any opinions, is for general information purposes only and it does not take into account your personal circumstances or objectives. This material has been prepared using the thoughts and opinions of the author and these may change. However, FOREX.com does not plan to provide further updates to any material once published and it is not under any obligation to keep this material up to date.
This material is short term in nature and may only relate to facts and circumstances existing at a specific time or day. Nothing in this material is (or should be considered to be) financial, investment, legal, tax or other advice and no reliance should be placed on it. No opinion given in this material constitutes a recommendation by FOREX.com or the author that any particular investment, security, transaction or investment strategy is suitable for any specific person.
The material has not been prepared in accordance with legal requirements designed to promote the independence of investment research. Although FOREX.com is not specifically prevented from dealing before providing this material, FOREX.com does not seek to take advantage of the material prior to its dissemination. This material is not intended for distribution to, or use by, any person in any country or jurisdiction where such distribution or use would be contrary to local law or regulation. For further details see our full non-independent research disclaimer and quarterly summary.