



Can natural gas break to a new high, or is it just hot air?
Natural gas has seen another strong rally, although lower oil prices yesterday saw it falter just beneath a key level of resistance, leaving clues of near-term exhaustion.
Share this:

During a joint press conference with the European Commission President two weeks ago, Joe Biden announced a plan to “reduce Europe’s dependence on Russian energy”. This is all well and good, but it remains debatable as to whether they replenish the gap left if they cease to use Russian oil by a large enough margin to not see prices skyrocket.
Russia currently supplies roughly 40% of Europe’s gas. And Russia threatened to turn off the gas tap if the West continues to sanction Russia due to the invasion of Ukraine. Clearly, this puts Europe in a tight spot and literally in short supply of an adequate energy supply if they simply ban Russia’s imports (or Russia stops exporting).
Replacing Russian energy is not so easy
The joint venture with the US and EU aims to reduce any such shortfall by setting a goal to deliver 15 billion cubic meters (BCM) of LNG (liquified natural gas) to the EU this year. This goal would then move up to 55 bcm by 2030. Russia currently supplies around 155 bcm per year, their current goal (if achieved) accounts for just 9.6% of what Russia currently supplies. That’s a big shortfall.
Furthermore, LNG experts have warned that weather is a key factor to where LNG ends up. If Asia experiences another cooler winter then the 15 bcm goal appears unrealistic, let alone the 50 bcm target further out. Still, the IEA (International Energy Agency) estimate they can source around 20 bcm of LNG (liquified natural gas) across global markets which might bump it up to 35 bcm. Yet even then it only accounts for around one fifth of the Russian supply, and this shortfall is a key reason as to why prices have continued to rally.
However, it’s not all about gas as oil plays a big part. And yesterday the IEA announced that 31 of its member nations are set to release 120 million barrels of oil from emergency reserves to counter tightening supply, 60 of which will come from the US. This saw oil prices fall around -5% yesterday and weigh broadly on the energy sector. In turn, natural gas futures have stalled at a critical level.
Natural gas falters at key resistance
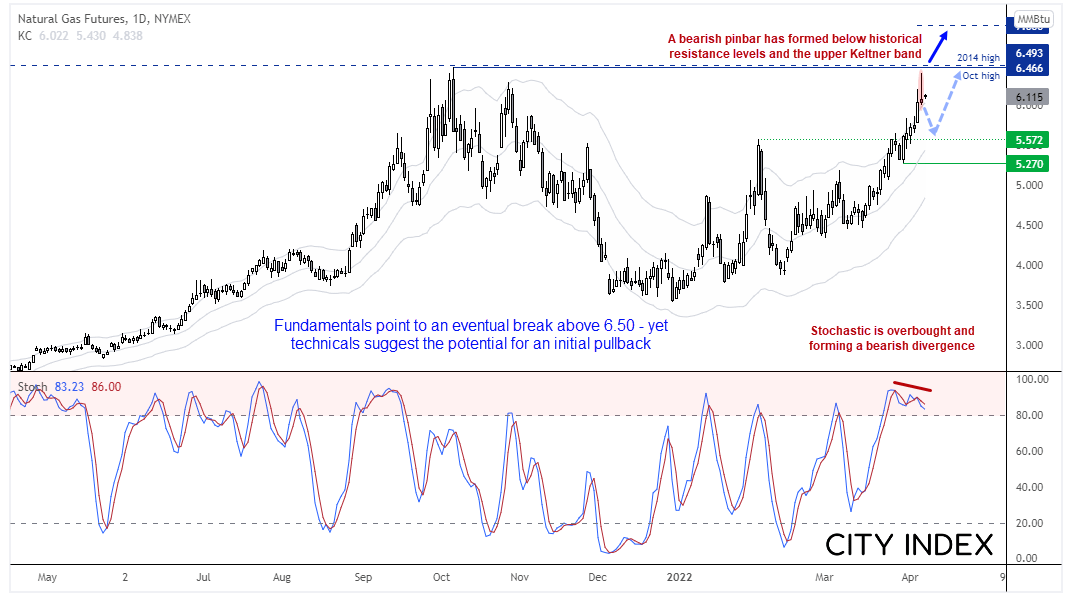
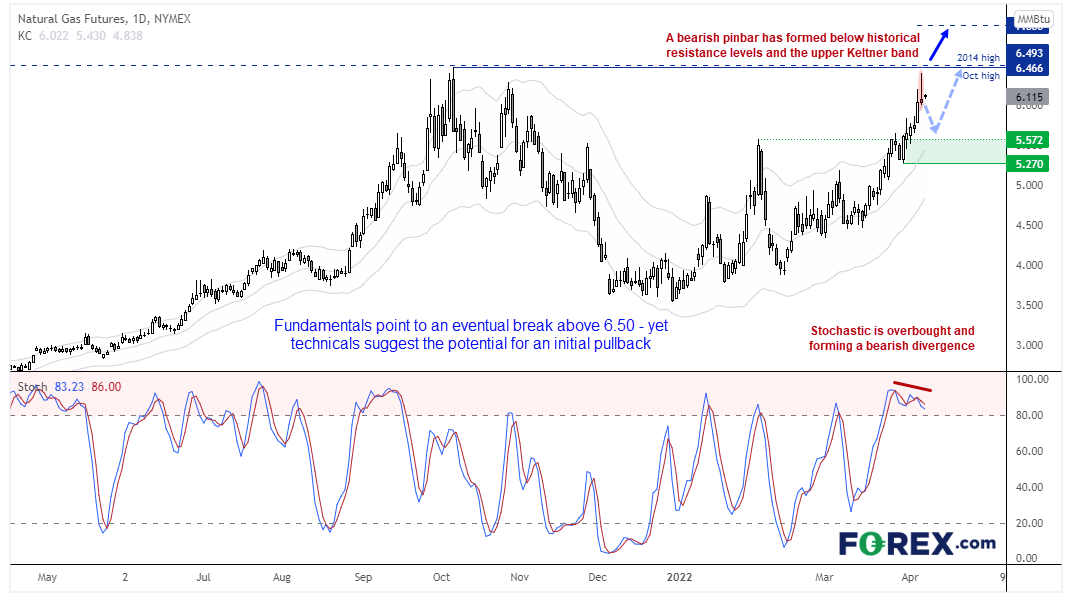
We can see on the daily chart that natural gas prices have regained bullish momentum since the middle of March. Yet news of the IEA flooding the market with oil helped natural gas reverse form its 6-month high and close the day with a bearish pinbar. The candle also faltered as its upper Keltner channel, whilst the stochastic oscillator is both oversold and producing a bearish divergence with prices. But more importantly, the rally has stalled just beneath the October high (6.466) and February 2014 high (6.493) which makes it an important pivotal level over the near-term.
Ultimately there are several clues that the upside move is exhausted over the near-term, just beneath a key resistance level. As things stand the fundamentals favour an eventual break above 6.50 over the coming week/s against the backdrop of no clear plan for Europe to replenish any Russian energy shortage. But we know that oil and natural gas can correlate on a daily basis, so weaker oil prices could help natural gas correct before its next leg higher. A break beneath yesterday’s low confirms the bearish pinbar and paves the way for a retracement. But we would then seek evidence of a swing low around or above support levels to anticipate the end of any such correction (however minor it may be).
A threat to its uptrend would likely require a solid plan to fully replace Russian oil. But until that happens, an eventual break above 6.50 appears likely.
Related tags:


Open an account in minutes
Experience award-winning platforms with fast and secure execution.
Economic calendar
Web Trader platform
Our sophisticated web-based platform is packed with features.
Related articles
China's steel slump leaves iron ore bulls under the pump
Iron ore has broken major support, threatening a return to the lows of 2022 as mounting evidence of weakness in China's steel sector reinforces the bearish outlook.

USD/JPY, AUD/JPY: Central Bank Divergence Creates Two-Way Risk
USD/JPY eyes a breakout above 160, while AUD/JPY faces further losses as Fed, RBA and BoJ interest rate expectations diverge.

DXY, GBP/USD, AUD/USD, USD/CAD, USD/JPY, Gold Weekly Technical Outlook 11 16 2026
Sr. Technical Strategist Michael Boutros highlights the levels that matter on the USD Majors, commodities, and equity indices charts this week.

StoneX Financial Ltd (trading as "FOREX.com") is an execution-only service provider. This material, whether or not it states any opinions, is for general information purposes only and it does not take into account your personal circumstances or objectives. This material has been prepared using the thoughts and opinions of the author and these may change. However, FOREX.com does not plan to provide further updates to any material once published and it is not under any obligation to keep this material up to date.
This material is short term in nature and may only relate to facts and circumstances existing at a specific time or day. Nothing in this material is (or should be considered to be) financial, investment, legal, tax or other advice and no reliance should be placed on it. No opinion given in this material constitutes a recommendation by FOREX.com or the author that any particular investment, security, transaction or investment strategy is suitable for any specific person.
The material has not been prepared in accordance with legal requirements designed to promote the independence of investment research. Although FOREX.com is not specifically prevented from dealing before providing this material, FOREX.com does not seek to take advantage of the material prior to its dissemination. This material is not intended for distribution to, or use by, any person in any country or jurisdiction where such distribution or use would be contrary to local law or regulation. For further details see our full non-independent research disclaimer and quarterly summary.