



Can the Hang Seng cobble together a sympathy bounce?
Whilst the overall trend and sentiment point lower, yesterday’s false break of support could provide a potential bounce for the Hang Seng index.
Share this:

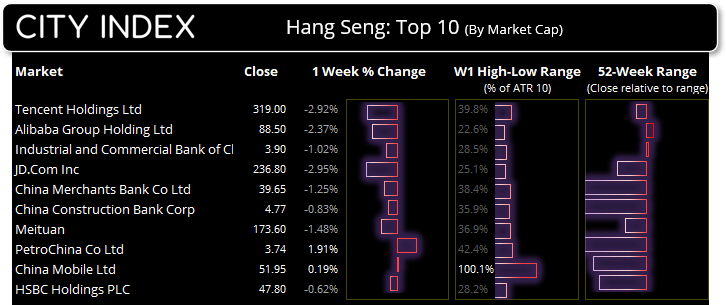
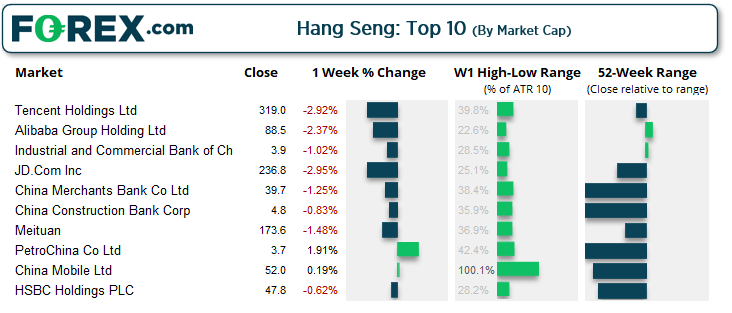
The combination of a weaker yuan and tighter COVID restrictions being announced across several large cities weighed on the Hang Seng yesterday, although the Shanghai Composite Index rose 0.4% thanks to a rise in oil prices.
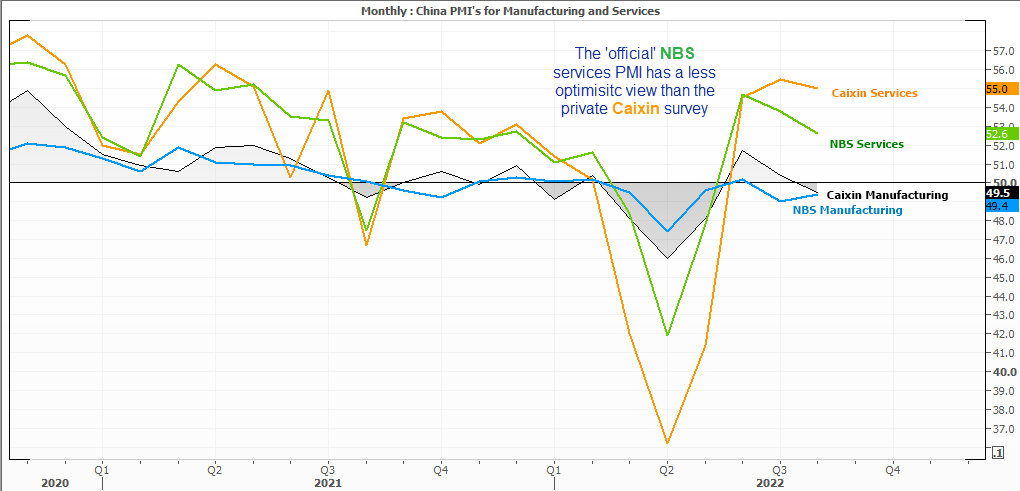
A private survey revealed that Services PMI expanded at a relatively healthy rate of 55, although down slightly from 55.5 the previous month. The expansion was driven by a “solid rise in overall sales” according to the Caixin China General Services PMI, and international demand remained subdued with foreign sales falling in August.
It’s interest to see a slight divergence between the ‘official’ NBS services PMI – which fell to 52.6 – whilst the Caixin sits at 55. Traditionally the NBS surveys have been the more optimistic of the two. But the private and official surveys agree that the manufacturing sector is contracting. Either way, growth targets have been lowered by several major banks this past week with some of the lower estimates sitting ~3% for China’s 2022 growth.
Despite new stimulus packages unveiled by the government and further easing from the PBOC (People’s Bank of China), critics hold the view it is not enough to support growth. This has seen Chinese equities remain under pressure overall, alongside global equites which face fears of a recession. But as markets do not move in straight lines it provides opportunities for countertrend traders along the way, and price action on the Hang Seng Index (HSI) has caught our eye.
Hang Seng daily chart:
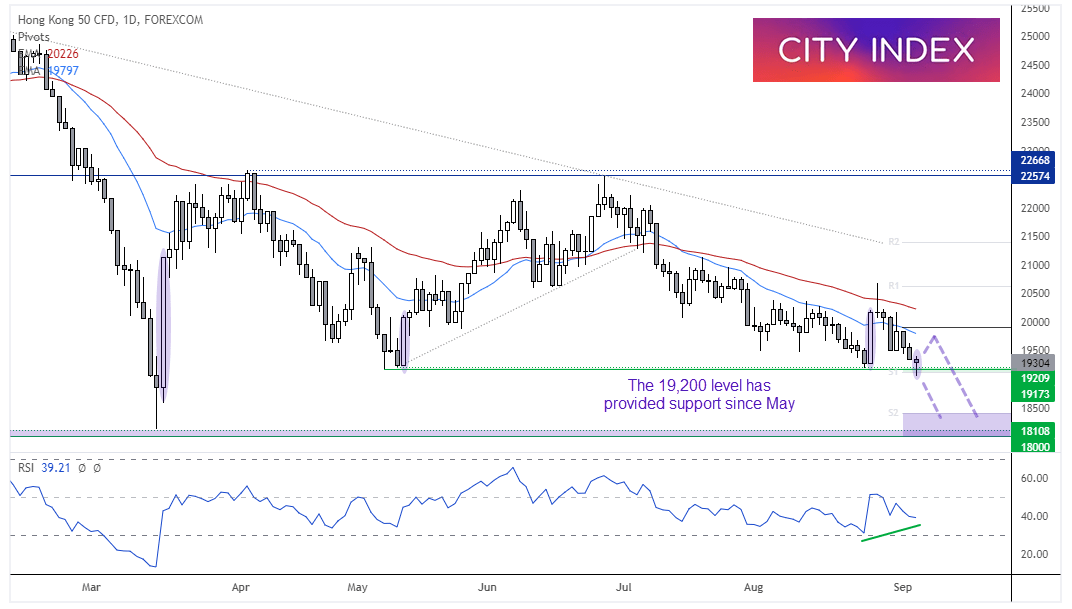
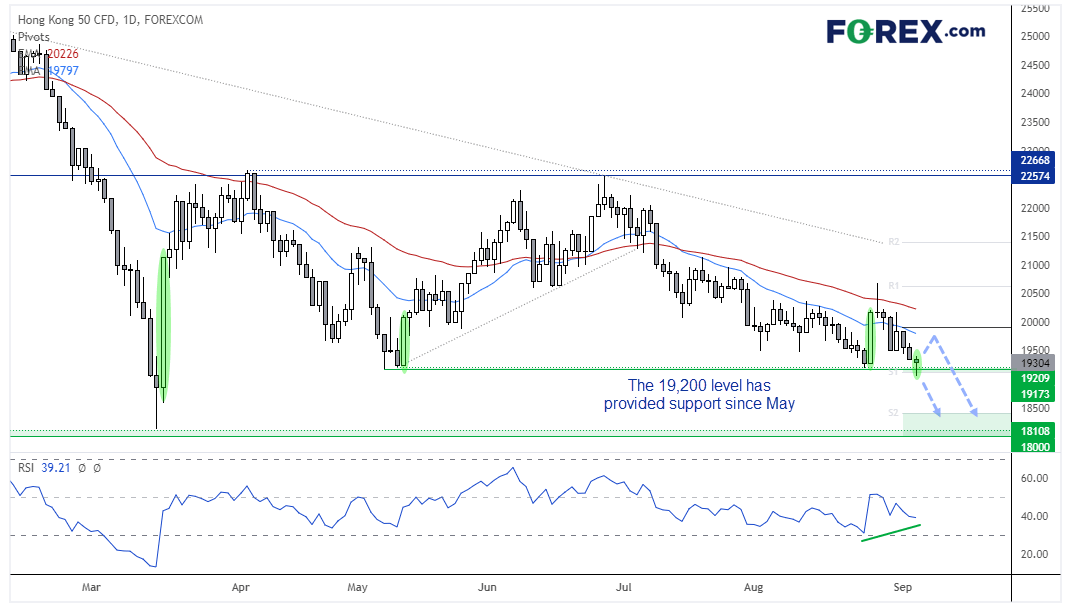
Despite its downtrend on the daily chart, the HSI produced a strong bullish engulfing candle on the 25th of August which showed strong demand around 19,200 – a level which has held since May (and a similar candle occurred). Whilst it printed a bearish pinbar and then fell back below 20,000, the fact it took 6 days to unwind the gains of the engulfing candle can be seen as a form of strength.
Also note that we saw a false break of the 19,200 support area yesterday despite the negative sentiment, and the day closed with a bullish hammer. Furthermore, the hammer formed and closed above key support and the weekly S1 pivot point, and a bullish divergence formed on the RSI.
The near-term bias remains bullish above yesterday’s low and for a move back to the 20-bar eMA, or weekly pivot point. Whereas a break beneath yesterday’s low (or daily close) assumes its next leg lower has begun and brings the 18,400 region into focus.
How to trade with City Index
You can easily trade with City Index by using these four easy steps:
- Open an account, or log in if you’re already a customer
• Open an account in the UK
• Open an account in Australia
• Open an account in Singapore
- Search for the company you want to trade in our award-winning platform
- Choose your position and size, and your stop and limit levels
- Place the trade
How to trade with FOREX.com
Follow these easy steps to start trading with FOREX.com today:
- Open a Forex.com account, or log in if you’re already a customer.
- Search for the pair you want to trade in our award-winning platform.
- Choose your position and size, and your stop and limit levels.
- Place the trade.
Related tags:



Open an account in minutes
Experience award-winning platforms with fast and secure execution.
Economic calendar
Web Trader platform
Our sophisticated web-based platform is packed with features.
Related articles
China's steel slump leaves iron ore bulls under the pump
Iron ore has broken major support, threatening a return to the lows of 2022 as mounting evidence of weakness in China's steel sector reinforces the bearish outlook.

USD/JPY, AUD/JPY: Central Bank Divergence Creates Two-Way Risk
USD/JPY eyes a breakout above 160, while AUD/JPY faces further losses as Fed, RBA and BoJ interest rate expectations diverge.

Gold and silver forecast: Precious metals extend drop but seasonality hopes keeps bullish case alive
It has been a risk off session so far today with stocks, gold and especially silver (-4%) all taking a drop. Gold has fallen to a fresh 2026 low and its now more than $100 below the psychologically important $4,000 mark. A firmer US dollar, rising US rate expectations and fading safe-haven demand have combined to undermine the metal, despite continued central bank buying. This year has so far been a bad one for gold.

StoneX Financial Ltd (trading as "FOREX.com") is an execution-only service provider. This material, whether or not it states any opinions, is for general information purposes only and it does not take into account your personal circumstances or objectives. This material has been prepared using the thoughts and opinions of the author and these may change. However, FOREX.com does not plan to provide further updates to any material once published and it is not under any obligation to keep this material up to date.
This material is short term in nature and may only relate to facts and circumstances existing at a specific time or day. Nothing in this material is (or should be considered to be) financial, investment, legal, tax or other advice and no reliance should be placed on it. No opinion given in this material constitutes a recommendation by FOREX.com or the author that any particular investment, security, transaction or investment strategy is suitable for any specific person.
The material has not been prepared in accordance with legal requirements designed to promote the independence of investment research. Although FOREX.com is not specifically prevented from dealing before providing this material, FOREX.com does not seek to take advantage of the material prior to its dissemination. This material is not intended for distribution to, or use by, any person in any country or jurisdiction where such distribution or use would be contrary to local law or regulation. For further details see our full non-independent research disclaimer and quarterly summary.