



CBA 1H2022 Earnings Preview: Where next for CBA stock?
The Commonwealth Bank of Australia (CBA) is Australia’s largest bank and provides various financial services, including retail, business, institutional banking, funds management, insurance, investment, and broking services. It reports its half-year numbers on the 9th of February.
Share this:

The Australian economic recovery from the covid pandemic extended strongly throughout FY2021, helping CBA to report a 19.8% in FY earnings to $8,653m and on the back of a strong balance sheet declared a fully franked dividend of $2.00 per share, bringing its full-year dividend payout to $3.50.
Putting the icing on the cake for investors, CBA announced a $6 billion off-market share buyback identified as the most efficient and appropriate way to return the surplus capital accumulated to weather the Covid storm.
However, since the end of FY 2021, the Australian economy has been hit by the Delta variant lockdown in NSW, Victoria, and the ACT, before the onset of the Omicron outbreak in mid-December.
In the drive to provide more certainty given prospects of higher interest rates, mortgage borrowers have been opting to fix their repayments. Fixed-rate loans are less profitable than loans fixed at variable rates.
This factor and strong competition in the sector for market share between the big banks and other mortgage lenders are expected to see a contraction in CBA’s net interest margin (NIM). From 2.03% in FY21 to 1.87% in FY22.
CBA has historically traded at a premium to its peers, and is currently trading on a P/E of 20x above the group average of 18x, despite offering a lower dividend yield of 3.73%.
The price premium is based on the belief that CBA has a more loyal shareholder base, is better managed than its peers, its commitment to investment, and holds a superior distribution franchise.
The market consensus is for CBA to report earnings of $4,500m for 1H2022, with an interim dividend payout of $1.81 per share.
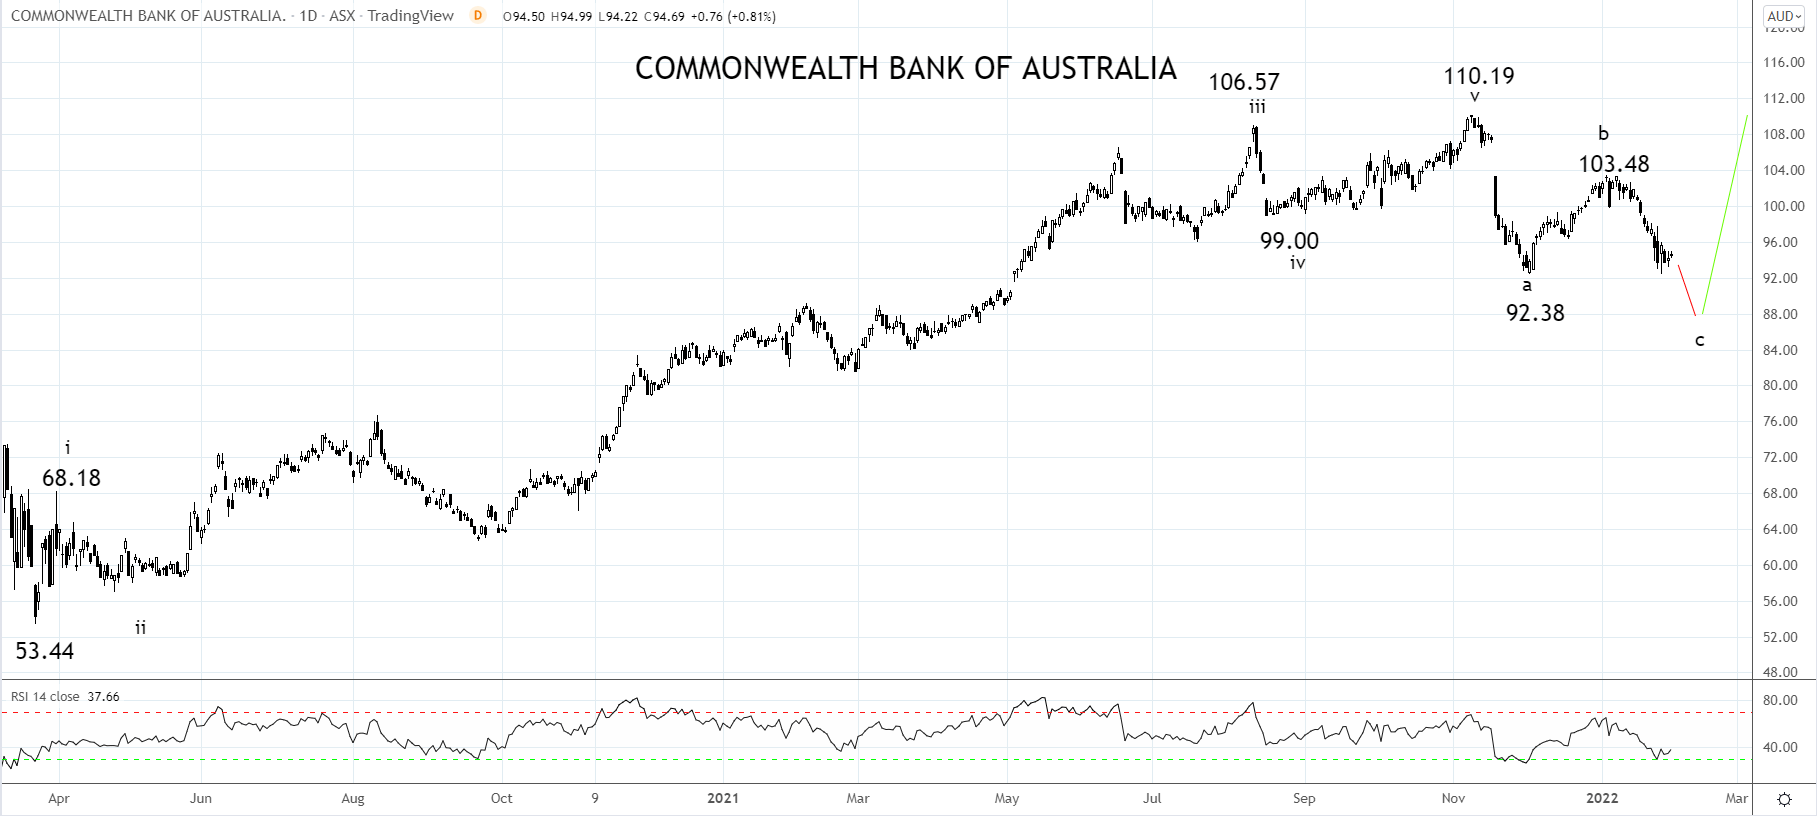
CBA Share Price Chart
In the lead-up to CBA’s report, the share price is trading at $93.93, 7% below where it started the year and over 14% below its November 2021 high of $110.19.
A break of support near $92.30 should see the correction in the share price extend towards wave equality support near $85.00, the preferred level to consider buying CBA.
Source Tradingview. The figures stated areas of the 2nd of February 2022. Past performance is not a reliable indicator of future performance. This report does not contain and is not to be taken as containing any financial product advice or financial product recommendation
How to trade with City Index
You can trade with City Index by following these four easy steps:
- Open an account, or log in if you’re already a customer
• Open an account in the UK
• Open an account in Australia
• Open an account in Singapore
- Search for the company you want to trade in our award-winning platform
- Choose your position and size, and your stop and limit levels
- Place the trade
The Australian economic recovery from the covid pandemic extended strongly throughout FY 2021, helping CBA to report a 19.8% in FY earnings to $8,653m and on the back of a strong balance sheet declared a fully franked dividend of $2.00 per share, bringing its full-year dividend payout to $3.50.
Putting the icing on the cake for investors, CBA announced a $6 billion off-market share buyback identified as the most efficient and appropriate way to return the surplus capital accumulated to weather the Covid storm.
However, since the end of FY 2021, the Australian economy has been hit by the Delta variant lockdown in NSW, Victoria, and the ACT, before the onset of the Omicron outbreak in mid-December.
In the drive to provide more certainty given prospects of higher interest rates, mortgage borrowers have been opting to fix their repayments. Fixed-rate loans are less profitable than loans fixed at variable rates.
This factor and strong competition in the sector for market share between the big banks and other mortgage lenders are expected to see a contraction in CBA’s net interest margin (NIM). From 2.03% in FY21 to 1.87% in FY22.
CBA has historically traded at a premium to its peers, and is currently trading on a P/E of 20x above the group average of 18x, despite offering a lower dividend yield of 3.73%.
The price premium is based on the belief that CBA has a more loyal shareholder base, is better managed than its peers, its commitment to investment, and holds a superior distribution franchise.
The market consensus is for CBA to report earnings of $4,500m for 1H2022, with an interim dividend payout of $1.81 per share.
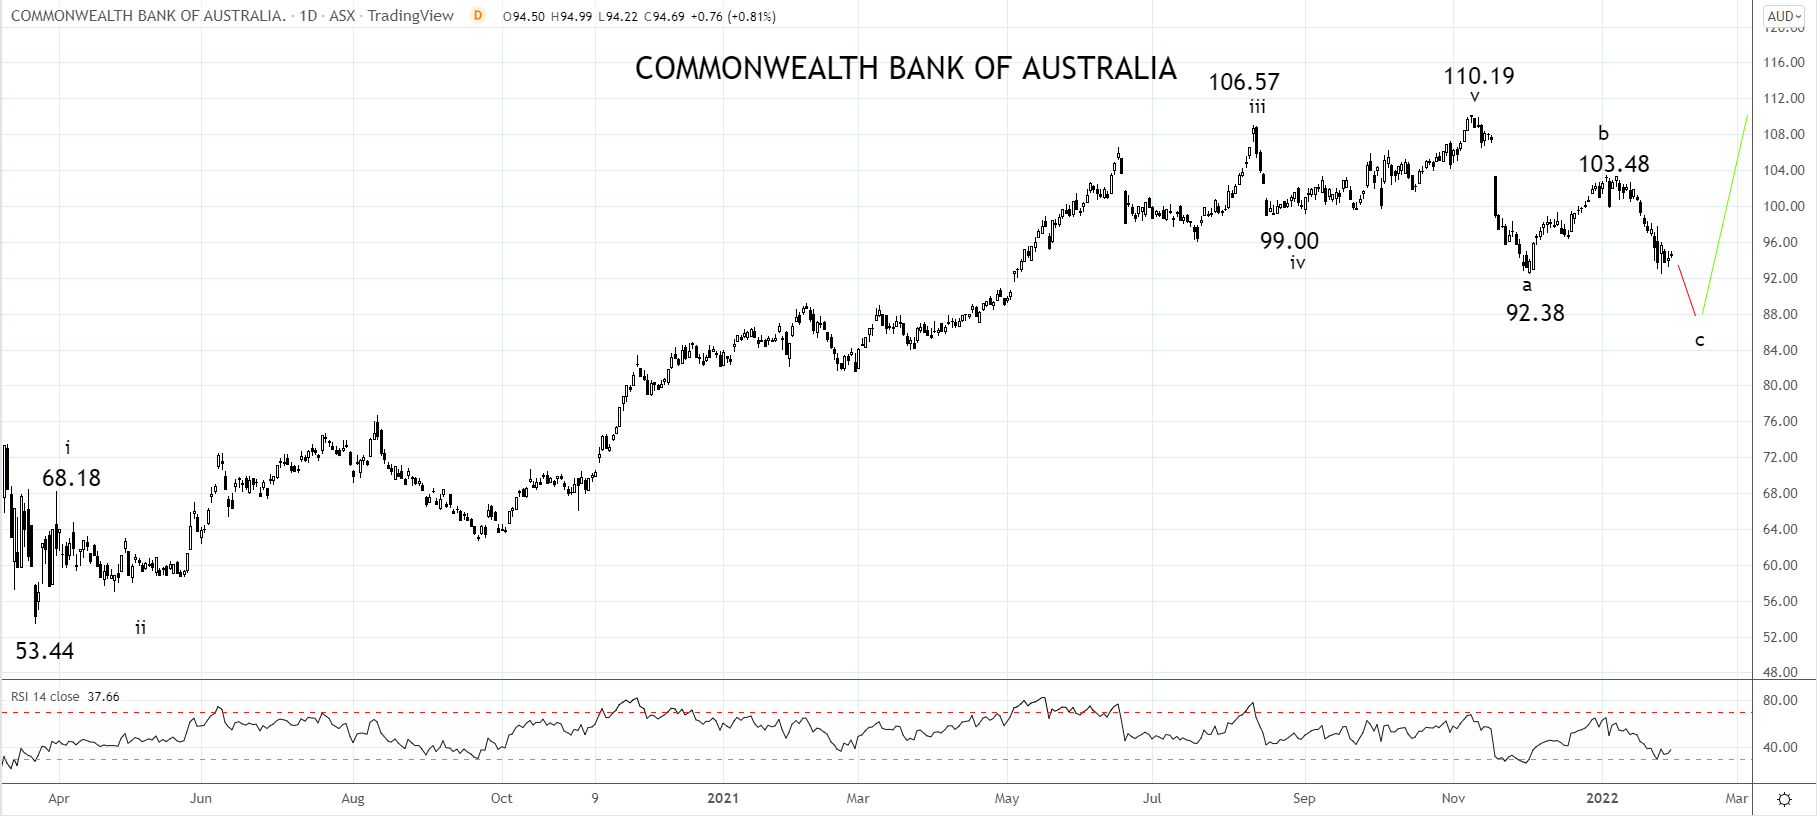
CBA Share Price Chart
In the lead-up to CBA’s report, the share price is trading at $93.93, 7% below where it started the year and over 14% below its November 2021 high of $110.19.
A break of support near $92.30 should see the correction in the share price extend towards wave equality support near $85.00, the preferred level to consider buying CBA.
Source Tradingview. The figures stated areas of the 2nd of February 2022. Past performance is not a reliable indicator of future performance. This report does not contain and is not to be taken as containing any financial product advice or financial product recommendation
- Open a Forex.com account, or log in if you’re already a customer.
- Search for the pair you want to trade in our award-winning platform.
- Choose your position and size, and your stop and limit levels.
- Place the trade.
Related tags:




Open an account in minutes
Experience award-winning platforms with fast and secure execution.
Economic calendar
Web Trader platform
Our sophisticated web-based platform is packed with features.
Related articles

Nvidia Earnings Preview: NVDA’s First Test of the Post Jenson Huang Era
Nvidia is expected to report $2.47 in EPS on $108.8B in revenue this quarter, but investors will be more interested in the company's guidance after the unexpected departure of founder and CEO Jenson Huang.


Nvidia Holds Support Ahead of Earnings as Nasdaq 100 Rebounds
Nvidia shares approach major support as selling pressure eases, while the Nasdaq 100 rebounds. Could upcoming earnings fuel a broader recovery?

S&P 500 Analysis: Earnings Uncertainty Continues to Weigh on the SPX
The trading week is coming to an end, and a phase of weakness remains evident across the S&P 500 in the short term. Recent price action reflects this dynamic, with SPX losing more than 2.00% over the last two trading sessions, bringing selling pressure back into focus.

StoneX Financial Ltd (trading as "FOREX.com") is an execution-only service provider. This material, whether or not it states any opinions, is for general information purposes only and it does not take into account your personal circumstances or objectives. This material has been prepared using the thoughts and opinions of the author and these may change. However, FOREX.com does not plan to provide further updates to any material once published and it is not under any obligation to keep this material up to date.
This material is short term in nature and may only relate to facts and circumstances existing at a specific time or day. Nothing in this material is (or should be considered to be) financial, investment, legal, tax or other advice and no reliance should be placed on it. No opinion given in this material constitutes a recommendation by FOREX.com or the author that any particular investment, security, transaction or investment strategy is suitable for any specific person.
The material has not been prepared in accordance with legal requirements designed to promote the independence of investment research. Although FOREX.com is not specifically prevented from dealing before providing this material, FOREX.com does not seek to take advantage of the material prior to its dissemination. This material is not intended for distribution to, or use by, any person in any country or jurisdiction where such distribution or use would be contrary to local law or regulation. For further details see our full non-independent research disclaimer and quarterly summary.