



DJIA This May Not be The Shoulder To Lean On
If you’re a bull – don’ t move. Bears, lean right on in as a break of this neckline could confirm a larger, bearish reversal on the Dow Jones Industrial index (DJIA).
Share this:

If you’re a bull – don’ t move. Bears, lean right on in as a break of this neckline could confirm a larger, bearish reversal on the Dow Jones Industrial index (DJIA).+
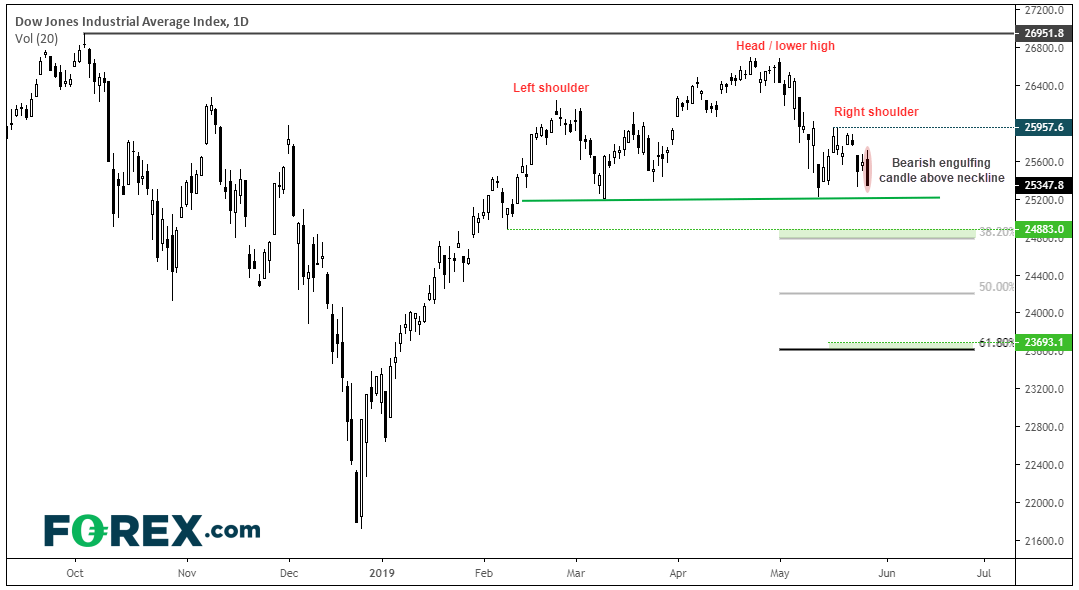
Last week we questioned the ‘rebound’ on the DJI. Citing unfavourable seasonality, false breaks on the S&P500 and Nasdaq along with a potential ‘right shoulder’ on DJI, it suggested a potential head and shoulders reversal could be forming. Fast forward to yesterday’s close and the right shoulder is shaping up nicely with a bearish engulfing candle stalling just above the neckline.
- If we are to see a break lower, we could use the support zone between the 38.2% Fibonacci level and 24,883 low as an initial (or intraday) target.
- Alternatively, we could see if the neckline breaks and then is respected before considering a swing trade short.
- If successful, the reversal pattern projects a target just above the 61.8% Fibonacci level.
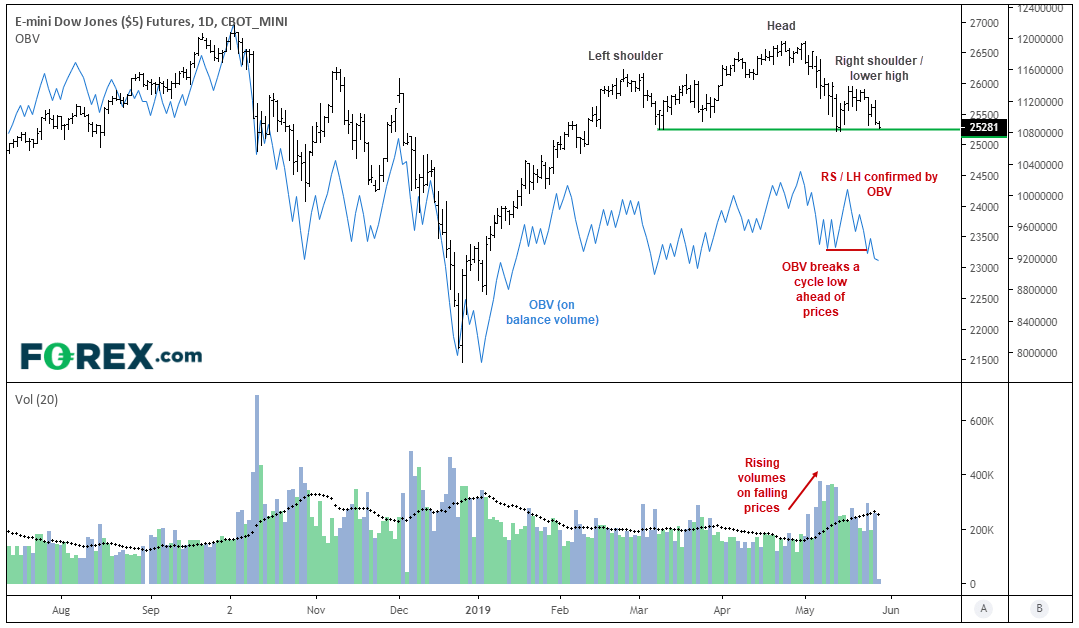
Moreover, volumes on the futures market also suggest bearish pressure is rising.
- Volumes were rising as prices fell, following its peak (head)
- OBV (on balance volume) confirmed the right shoulder / lower high and tracked the right shoulder to confirm the balance of bullish and bearish volume throughout
- OBV has broken its cycle low ahead of prices breaking its own neckline, which can sometimes occur ahead of a breakout.
It’s interesting to note that DJI has stalled above its neckline as the US10Y yield hit a new cycle low (currently its lowest since September 2017). Currently trading beneath its lower Keltner channel, the argument for over-extension is on the rise – and we can see how it can bounce back if too far beneath it. If yields to rise from current levels, this could provide opportunity for DJI to remain above tis neckline but, given the bearish trend on yields, we suspect it could just be delaying the inevitable and for DJI’s neckline to eventually break. Either way, let price action be your guide.
#US10Y yields its lowest since September 2017.
— FOREX.com (@FOREXcom) May 29, 2019
That's not to say it's not due another bounce due to over-extension but... #trend remains clearly #bearish . So we cannot rule out new cycle lows either. ^MS #bonds #sentiment pic.twitter.com/Pn2NvgIYNG
Related tags:
Latest market news




Open an account in minutes
Experience award-winning platforms with fast and secure execution.
Economic calendar
Web Trader platform
Our sophisticated web-based platform is packed with features.
Related articles

Nikkei swings harder than Nasdaq as AI fears deepen
Nikkei 225 volatility is running well ahead of Nasdaq 100, with the index construction and Japan's heavy exposure to AI manufacturing potentially explaining the difference.

S&P 500, Nasdaq 100 Claw Back But NVDA Cloud Looms Overhead
Last week was green for both the Nasdaq and S&P 500 but given the sell-off that led into that bounce there’s still a very real question as to whether bears still have a statement to make. And the NVDA situation presents a very real threat.


Nasdaq 100 forecast: Nvidia troubles put AI recovery into question
The recovery for major indices this week has helped repair much of the technical damage inflicted by last week’s sell-off, but the latest developments with Nvidia suggest investors are not quite ready to put the underlying risks behind them. The Nasdaq 100 led other US index futures lower overnight, with falls of around 0.8%.

StoneX Financial Ltd (trading as "FOREX.com") is an execution-only service provider. This material, whether or not it states any opinions, is for general information purposes only and it does not take into account your personal circumstances or objectives. This material has been prepared using the thoughts and opinions of the author and these may change. However, FOREX.com does not plan to provide further updates to any material once published and it is not under any obligation to keep this material up to date.
This material is short term in nature and may only relate to facts and circumstances existing at a specific time or day. Nothing in this material is (or should be considered to be) financial, investment, legal, tax or other advice and no reliance should be placed on it. No opinion given in this material constitutes a recommendation by FOREX.com or the author that any particular investment, security, transaction or investment strategy is suitable for any specific person.
The material has not been prepared in accordance with legal requirements designed to promote the independence of investment research. Although FOREX.com is not specifically prevented from dealing before providing this material, FOREX.com does not seek to take advantage of the material prior to its dissemination. This material is not intended for distribution to, or use by, any person in any country or jurisdiction where such distribution or use would be contrary to local law or regulation. For further details see our full non-independent research disclaimer and quarterly summary.