



EUR/USD forecast: Technical Tuesday | August 25, 2026
The relative calm in the energy and bond markets have allowed the US dollar and equities to make a slightly positive start to the week. America’s economic war on Iran also failed to trigger any panic, leaving investors with little to chew over until the release of US inflation data on Wednesday and Kevin Warsh’s speech at the Jackson Hole Symposium on Friday.
Share this:

The relative calm in the energy and bond markets have allowed the US dollar and equities to make a slightly positive start to the week. America’s economic war on Iran also failed to trigger any panic, leaving investors with little to chew over until the release of US inflation data on Wednesday and Kevin Warsh’s speech at the Jackson Hole Symposium on Friday. For now, consolidation is the name of the game but the risks to the near term EUR/USD forecast remains tilted to the upside.
Could Pakistan help revived US-Iran talks?
Oil prices fell yesterday after the US announced new sanctions on Iran and threatened economic penalties against countries that fail to cut ties with Tehran. China is the obvious focus. A serious revival of US-China trade tensions would be negative for the dollar, consistent with the currency’s relationship with the trade dispute last year.
Markets are hoping that the new wave of sanctions could bring Tehran back to the negotiating table, which partly explains why the price of oil has fallen back in the last couple of days.
Apparently, there is also a fresh push from Pakistan to try and re-start the stalled talks. Al-Arabiya reported that Pakistan’s Asim Munir is carrying an offer to Tehran to halt the siege and lift sanctions under the memorandum of understanding. Oil fell by an additional 3% on the back of this MF Albright it remains to be seen whether the losses will hold and whether this will lead to anything significant between the two sides.
German economy continues to surprise: Ifo rises to 1-year high
One of Germany’s most important leading indicators, the Ifo index, which is based on surveyed manufacturers, builders, wholesalers, services and retailers, once again came out stronger than expected this morning. Despite everything that’s going on right now, most worryingly in the energy market, the Ifo increased to 88.8 in August, from 86.6 in July. The index has now risen for the fourth consecutive month to a one-year-high. Not only did the surgery’s current assessment improved, but so too did the expectations component.
The latest data shows Germany’s economy and sentiment has become immune to the oil shock to some degree, which explains why the DAX is trading close to record highs and why the euro refuses to succumb to pressure.
Bond market uncertainty lingers for the dollar ahead of key data
The US dollar continues to take its cue from the bond market, where a firmer session yesterday eased some pressure on the greenback. Yields remain near multi-year highs, however, and any further signs of stress here could easily send the greenback lower once more.
Some attention will be on US data this week, ahead of Jackson Hole summit. Today, attention turns to housing figures and August consumer confidence, following softer readings in June and July.
The balance of risks for the dollar remains tilted to the downside, although the next decisive move is unlikely to happen until Kevin Warsh’s speech at Jackson Hole on Friday.
Technical EUR/USD forecast: Bear trap?
The EUR/USD chart may be looking a little more bearish again after two consecutive doji candles following the recent sharp advance. But is this simply another trap for the bears?
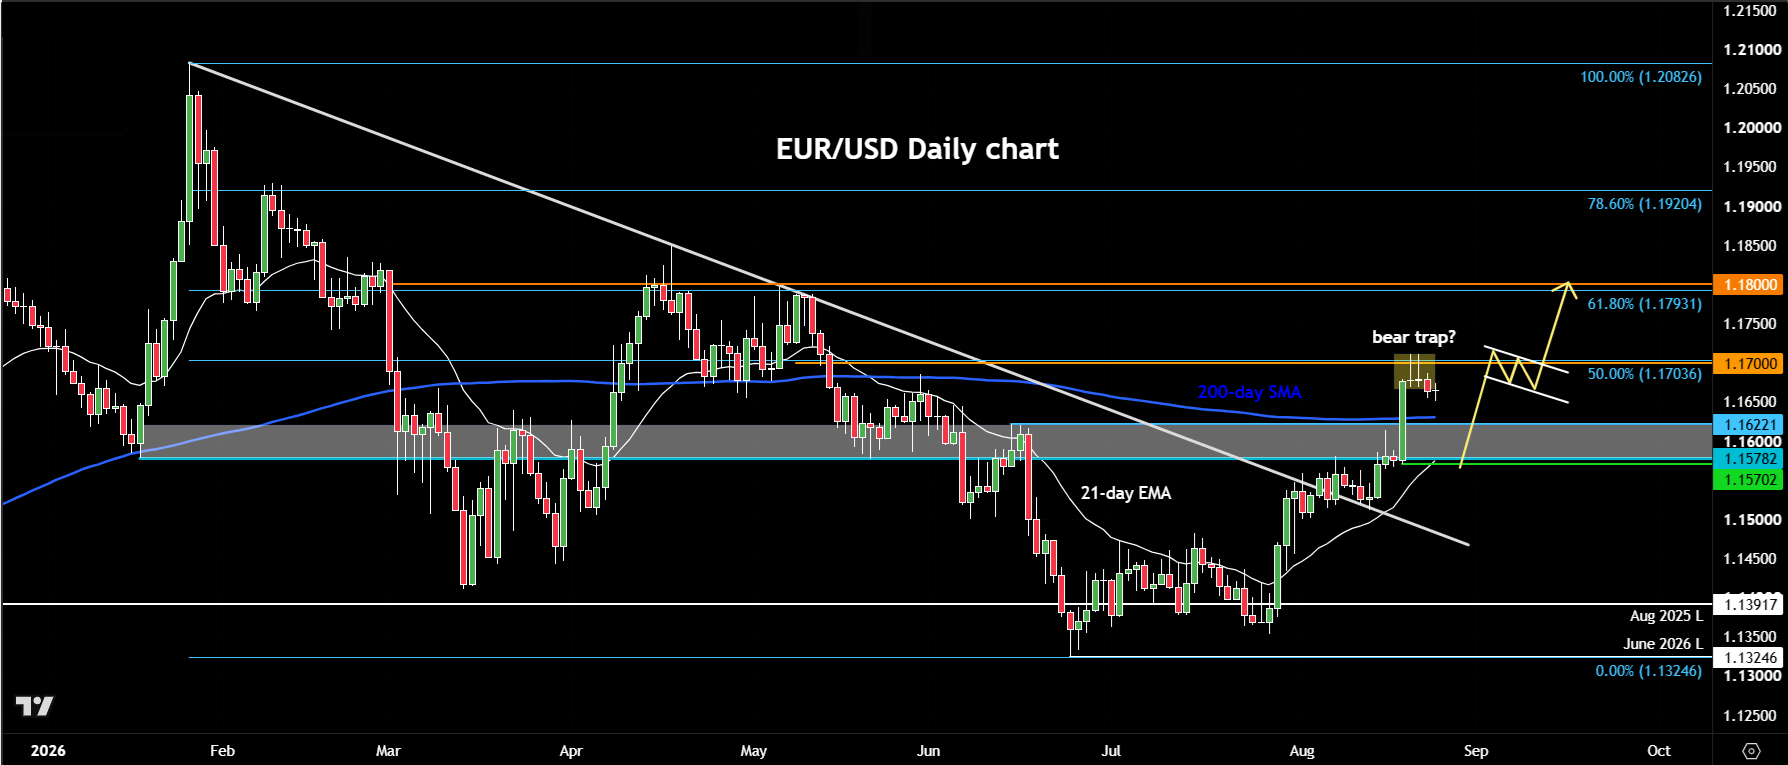
The technical EUR/USD forecast has turned decisively more constructive following the break above the previous bearish trend and the subsequent upside follow-through. The pair has already reached its first major target around 1.1700, where the 50% Fibonacci retracement of the January-to-June decline comes into play. It has since stalled at this level, forming two doji candles over the past two sessions.
In isolation, that would normally be interpreted as a warning sign for the bulls. But context matters. Given the scale of the preceding breakout, the current pause could instead prove to be a bear trap. A modest pullback would not necessarily change the broader picture and could even help clear out some of the recent long positions before another attempt higher.
On the downside, the 1.1575–1.1625 area is now the key support zone. The upper end of this range is roughly where the 200-day moving average comes into play, while the lower end marks the origin of the recent breakout.
As long as EUR/USD holds above 1.1575, the technical bias remains bullish. A sustained move back below this level, however, would weaken the current bullish structure and raise the prospect that the breakout was ultimately a false one.
Above 1.1700, attention would turn towards 1.1800, where the 61.8% Fibonacci retracement of the January-to-June decline sits. For now, the key question is whether this latest pause develops into a deeper correction – or simply sets the stage for another leg higher. For what it is worth, I think the latter.

-- Written by Fawad Razaqzada, Market Analyst
Follow Fawad on Twitter @Trader_F_R


Open an account in minutes
Experience award-winning platforms with fast and secure execution.
Economic calendar
Web Trader platform
Our sophisticated web-based platform is packed with features.
Related articles
US dollar rally loses yield support as Nvidia looms
US yields are retreating, but the dollar isn't following. With risk aversion potentially keeping it supported, Nvidia's results could determine whether emerging reversal signals in AUD/USD and EUR/USD develop further.

GBP/USD, GBP/JPY, GBP/AUD: Sterling Eyes UK Inflation Catalyst
Sterling faces a pivotal UK inflation test as traders weigh BoE tightening, Fed minutes and Australian employment data across GBP/USD, GBP/JPY and GBP/AUD.


US Dollar Price Action Setups: EUR/USD, USD/JPY, GBP/USD, USD/CAD
In a wide ranging webinar multiple USD pairs were in focus, continuing last week’s rally in DXY as EUR/USD tests 1.1000 and USD/JPY tests the 160.00 level.

StoneX Financial Ltd (trading as "FOREX.com") is an execution-only service provider. This material, whether or not it states any opinions, is for general information purposes only and it does not take into account your personal circumstances or objectives. This material has been prepared using the thoughts and opinions of the author and these may change. However, FOREX.com does not plan to provide further updates to any material once published and it is not under any obligation to keep this material up to date.
This material is short term in nature and may only relate to facts and circumstances existing at a specific time or day. Nothing in this material is (or should be considered to be) financial, investment, legal, tax or other advice and no reliance should be placed on it. No opinion given in this material constitutes a recommendation by FOREX.com or the author that any particular investment, security, transaction or investment strategy is suitable for any specific person.
The material has not been prepared in accordance with legal requirements designed to promote the independence of investment research. Although FOREX.com is not specifically prevented from dealing before providing this material, FOREX.com does not seek to take advantage of the material prior to its dissemination. This material is not intended for distribution to, or use by, any person in any country or jurisdiction where such distribution or use would be contrary to local law or regulation. For further details see our full non-independent research disclaimer and quarterly summary.