



EUR/AUD and EUR/NZD trying to hammer out a bottom
With many commodities such as oil, gold, and wheat soaring, commodity currencies have gone along for the ride.
Share this:

The Euro has been moving lower against many currencies lately. For example, EUR/USD has moved from 1.1498 down to 1.0806 over the last month! And one can see as to why:
- The Euro zone is a neighbor to a current war zone country, Ukraine.
- Though inflation has been increasing over last year, the ECB remains dovish (for the moment). The central bank continues to purchase bonds and will continue to do so for at least the next 6 months.Note that the ECB meets on Thursday and it could decide to increase the pace of bond tapering.
Meanwhile, the Australia Dollar and the New Zealand Dollar have been on the rise. With many commodities such as oil, gold, and wheat soaring, commodity currencies have gone along for the ride. For example, since January 28th, AUD/USD has moved from 0.6968 up to 0.7441 while NZD/USD has moved from 0.6529 up to 0.6926. Therefore, it would make sense for EUR/AUD and EUR/NZD to move lower.
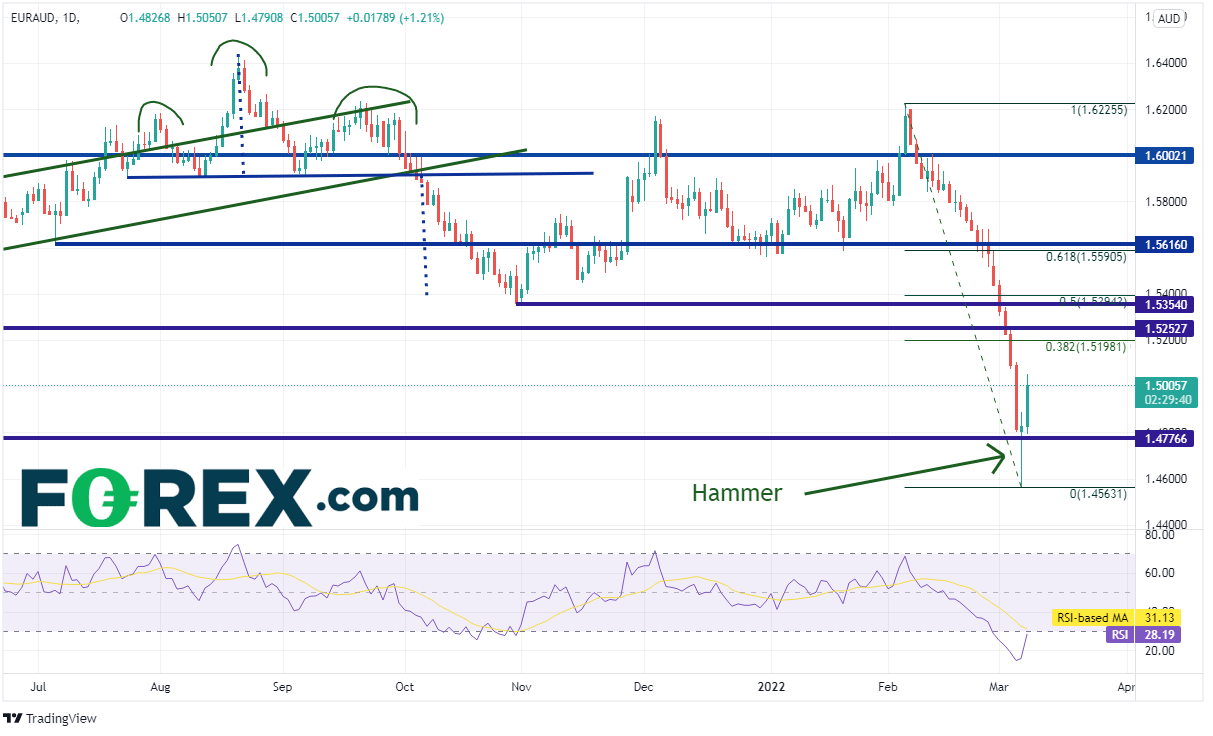
EUR/AUD has been moving aggressively lower since February 4th, when the pair made a high of 1.6225. Yesterday, the pair bottomed at 1.4563, a move of 1,662 pips in just over a month! However, yesterday’s candlestick formation was a hammer, in which price opens and moves lower early in the session. Later, buyers enter the market and bring price back up to close near the open for the day. A hammer is a one candle reversal formation. With today’s price action moving higher, some may consider this a morning star formation, which is a 3-candlestick reversal pattern. Price moves lower the first day, makes a hammer formation the second day, and closes higher (near the first day open) on the last day. The 3-candlestick formation is a stronger signal than the hammer by itself.
Source: Tradingview, Stone X
Notice that the RSI is still in oversold conditions despite the move higher. If the RSI reaches 30, it will provide more support for a pause or reversal of the downtrend. First support is at yesterday’s low of 1.4463 then horizontal support at the July 2017 lows near 1.4407. The first resistance is at the 38.2% Fibonacci retracement from the highs of February 4th to yesterday’s lows, near 1.5198. If price breaks above there, horizontal resistance sits at 1.5253 and 1.5354.
The price action for EUR/NZD has been similar to that of EUR/AUD. On February 4th, the pair made a high of 1.7359. Yesterday, the pair bottomed at 1.5642, a move of 1,717 pips in just over a month! Yesterday’s price action formed a hammer on the daily timeframe. However, this price action would not be considered a morning star formation because EUR/NZD didn’t retrace nearly as much of the first day of the potential pattern as EUR/AUD.

Source: Tradingview, Stone X
Notice that the RSI for EUR/NZD is still in oversold conditions despite the move higher, just as with the RSI for EUR/AUD. If the RSI reaches 30, it will provide more support for a pause or reversal of the downtrend. First support is at yesterday’s low of 1.5642, then the July 2017 lows near 1.5237! Horizontal resistance is at today’s high of 1.6064. Above there is horizontal resistance and the 38.2% Fibonacci retracement from the February 4th highs to yesterday’s lows, near 1.6300. The third resistance is at the 50% retracement from the same timeframe at 1.6500.
The Euro has been moving lower against many currencies lately. For example, EUR/USD has moved from 1.1498 down to 1.0806 over the last month! And one can see as to why:
- The Euro zone is a neighbor to a current war zone country, Ukraine.
- Though inflation has been increasing over last year, the ECB remains dovish (for the moment). The central bank continues to purchase bonds and will continue to do so for at least the next 6 months.Note that the ECB meets on Thursday and it could decide to increase the pace of bond tapering.
Meanwhile, the Australia Dollar and the New Zealand Dollar have been on the rise. With many commodities such as oil, gold, and wheat soaring, commodity currencies have gone along for the ride. For example, since January 28th, AUD/USD has moved from 0.6968 up to 0.7441 while NZD/USD has moved from 0.6529 up to 0.6926. Therefore, it would make sense for EUR/AUD and EUR/NZD to move lower.
Trade EUR/AUD now: Login or Open a new account!
• Open an account in the UK
• Open an account in Australia
• Open an account in Singapore
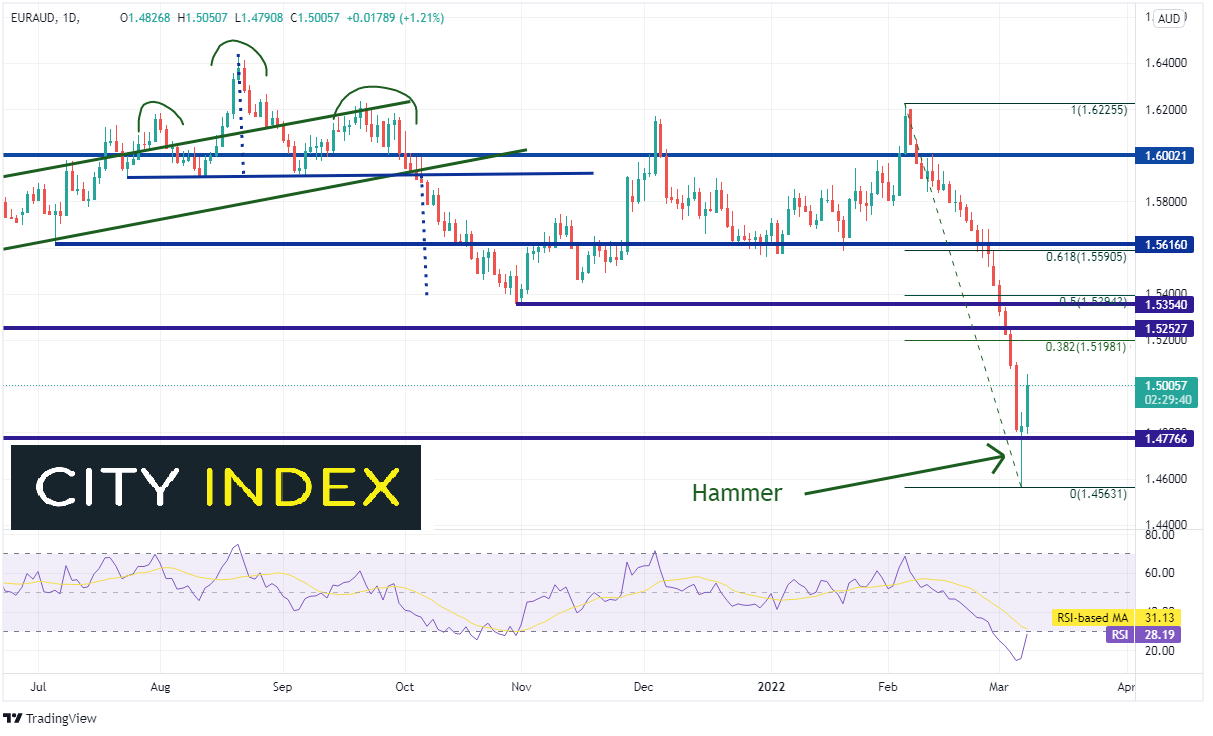
EUR/AUD has been moving aggressively lower since February 4th, when the pair made a high of 1.6225. Yesterday, the pair bottomed at 1.4563, a move of 1,662 pips in just over a month! However, yesterday’s candlestick formation was a hammer, in which price opens and moves lower early in the session. Later, buyers enter the market and bring price back up to close near the open for the day. A hammer is a one candle reversal formation. With today’s price action moving higher, some may consider this a morning star formation, which is a 3-candlestick reversal pattern. Price moves lower the first day, makes a hammer formation the second day, and closes higher (near the first day open) on the last day. The 3-candlestick formation is a stronger signal than the hammer by itself.
Source: Tradingview, Stone X
How to trade the morning star pattern
Notice that the RSI is still in oversold conditions despite the move higher. If the RSI reaches 30, it will provide more support for a pause or reversal of the downtrend. First support is at yesterday’s low of 1.4463 then horizontal support at the July 2017 lows near 1.4407. The first resistance is at the 38.2% Fibonacci retracement from the highs of February 4th to yesterday’s lows, near 1.5198. If price breaks above there, horizontal resistance sits at 1.5253 and 1.5354.
The price action for EUR/NZD has been similar to that of EUR/AUD. On February 4th, the pair made a high of 1.7359. Yesterday, the pair bottomed at 1.5642, a move of 1,717 pips in just over a month! Yesterday’s price action formed a hammer on the daily timeframe. However, this price action would not be considered a morning star formation because EUR/NZD didn’t retrace nearly as much of the first day of the potential pattern as EUR/AUD.

Source: Tradingview, Stone X
Trade EUR/NZD now: Login or Open a new account!
• Open an account in the UK
• Open an account in Australia
• Open an account in Singapore
Notice that the RSI for EUR/NZD is still in oversold conditions despite the move higher, just as with the RSI for EUR/AUD. If the RSI reaches 30, it will provide more support for a pause or reversal of the downtrend. First support is at yesterday’s low of 1.5642, then the July 2017 lows near 1.5237! Horizontal resistance is at today’s high of 1.6064. Above there is horizontal resistance and the 38.2% Fibonacci retracement from the February 4th highs to yesterday’s lows, near 1.6300. The third resistance is at the 50% retracement from the same timeframe at 1.6500.
Learn more about forex trading opportunities.
Related tags:


Open an account in minutes
Experience award-winning platforms with fast and secure execution.
Economic calendar
Web Trader platform
Our sophisticated web-based platform is packed with features.
Related articles
US dollar rally loses yield support as Nvidia looms
US yields are retreating, but the dollar isn't following. With risk aversion potentially keeping it supported, Nvidia's results could determine whether emerging reversal signals in AUD/USD and EUR/USD develop further.

GBP/USD, GBP/JPY, GBP/AUD: Sterling Eyes UK Inflation Catalyst
Sterling faces a pivotal UK inflation test as traders weigh BoE tightening, Fed minutes and Australian employment data across GBP/USD, GBP/JPY and GBP/AUD.


USD/MXN Forecast: Is Super Peso Making a Comeback?
The latest trading sessions have once again highlighted the strength of the Mexican peso. The currency has managed to regain a consistent appreciation trend in the short term, even despite the renewed strength displayed by the U.S. dollar in recent sessions.

StoneX Financial Ltd (trading as "FOREX.com") is an execution-only service provider. This material, whether or not it states any opinions, is for general information purposes only and it does not take into account your personal circumstances or objectives. This material has been prepared using the thoughts and opinions of the author and these may change. However, FOREX.com does not plan to provide further updates to any material once published and it is not under any obligation to keep this material up to date.
This material is short term in nature and may only relate to facts and circumstances existing at a specific time or day. Nothing in this material is (or should be considered to be) financial, investment, legal, tax or other advice and no reliance should be placed on it. No opinion given in this material constitutes a recommendation by FOREX.com or the author that any particular investment, security, transaction or investment strategy is suitable for any specific person.
The material has not been prepared in accordance with legal requirements designed to promote the independence of investment research. Although FOREX.com is not specifically prevented from dealing before providing this material, FOREX.com does not seek to take advantage of the material prior to its dissemination. This material is not intended for distribution to, or use by, any person in any country or jurisdiction where such distribution or use would be contrary to local law or regulation. For further details see our full non-independent research disclaimer and quarterly summary.