



European Open: USD/JPY hits a 32-year high and brings 150 within sight
Another day, another handle conquered for USD/JPY. And whilst it flirts with 149 traders are questioning if 150 is up next.
Share this:

Asian Indices:
- Australia's ASX 200 index rose by 106.3 points (1.6%) and currently trades at 6,770.70
- Japan's Nikkei 225 index has risen by 209.87 points (0.78%) and currently trades at 26,958.66
- Hong Kong's Hang Seng index has risen by 65.8 points (0.4%) and currently trades at 16,678.70
- China's A50 Index has risen by 5.1 points (0.04%) and currently trades at 12,767.93
UK and Europe:
- UK's FTSE 100 futures are currently up 23.5 points (0.34%), the cash market is currently estimated to open at 6,943.74
- Euro STOXX 50 futures are currently up 5 points (0.15%), the cash market is currently estimated to open at 3,446.64
- Germany's DAX futures are currently up 21 points (0.17%), the cash market is currently estimated to open at 12,670.03
US Futures:
- DJI futures are currently up 253 points (0.84%)
- S&P 500 futures are currently up 125.5 points (1.13%)
- Nasdaq 100 futures are currently up 37.25 points (1.01%)


China’s equity markets were off to a weak start following news of more Covid restrictions in China. Flareups in Zhenzhou City resulted in around 1 million residents locked down. However, positive (or less disappointing than feared) earnings helped lift Wal Street into the close, which seemingly had the greater impact across Asia as the session evolved with all major benchmarks now higher than yesterday’s close.
NZD is the strongest major following hot inflation print
New Zealand became the latest in a long list of ‘hotter-than-expected’ inflation reports, with it rising in Q3 by 7.2% y/y versus 6.6% expected, or 2.2% q/q compared with 1.6% expected. This saw NZD pairs and the OIS curve move higher as traders priced in a tighter trajectory of hikes.
The RBA minutes were also released which hinted at a longer cycle of rate hikes, but at a much slower pace than elsewhere. 25bp increments appear the more likely going forward, although as of yet unsure of or when they may take a pause to assess what impact the current tightening cycle has had.
Traders have 150 USD/JPY within sight

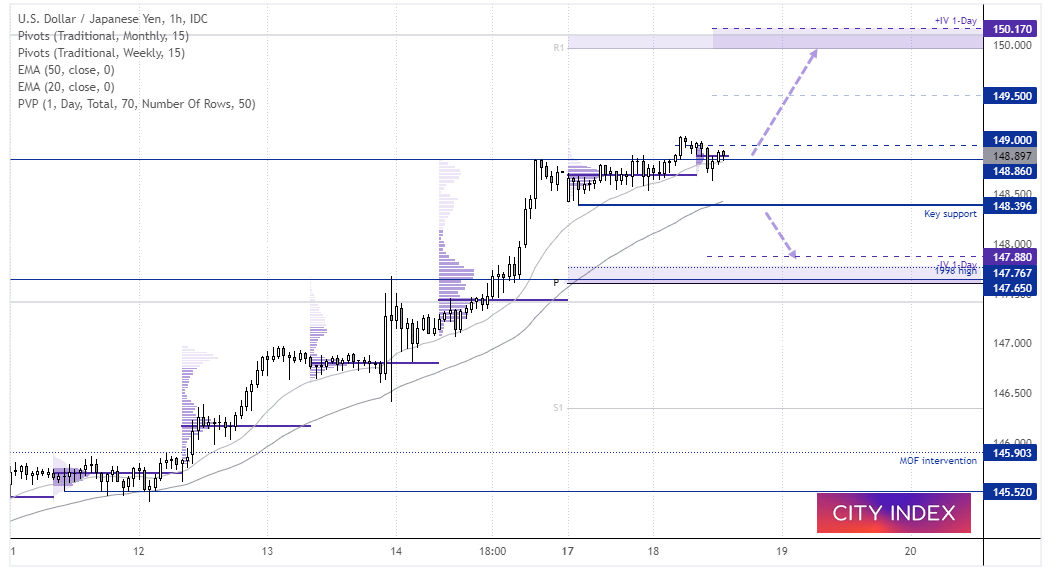
USD/JPY is cautiously trading around the 149, a level it crossed in the final stages of the US session to take it to its highest level since 1990. Its epic rally of late needs no introduction, and the only thing that seems to hold the rally back once in a while is whether we’ll see an intervention from the MOF or BOJ. Yet traders take comfort in knowing that the BOJ are happy to let the currency slide, so long as it is not too quickly (volatile).
The 1-hour chart shows the 10-bar EMA has provided dynamic support, but if it dips lower after the European open then we’d seek evidence of a swing low down to the 148.39 area. Take note that the 1-day +IV I just above 150 and the weekly R1 pivot, so 150 is a potential target for bulls with 149.50 also in focus along the way.
However, if prices break below 148.39 then it runs the risk of a deeper pullback towards 148, given the lack of volumes that traded during the prior rally through this zone.
GBP/JPY 30minute chart:
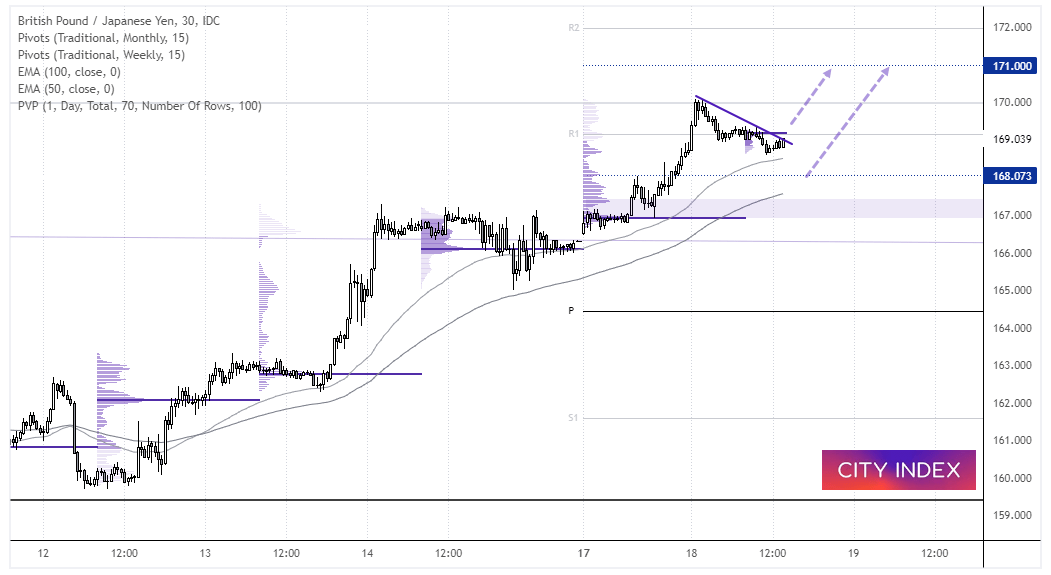
If USD/JPY rallies then there is also a decent chance that GBP/JPY will follow, as it has the fundamental tailwind of the reformed economic package from the UK government. A strong bullish trend has developed on the 30-minute chart and prices are within a retracement phase. We’re equally happy to seek evidence of a swing low around or above a support level, or seek bullish momentum turn suggest its bullish rally has resumed.
DAX performance:


FTSE 350 – Market Internals:
FTSE 350: 3820.18 (0.90%) 17 October 2022
- 322 (92.00%) stocks advanced and 26 (7.43%) declined
- 2 stocks rose to a new 52-week high, 5 fell to new lows
- 14.29% of stocks closed above their 200-day average
- 18.57% of stocks closed above their 50-day average
- 6.29% of stocks closed above their 20-day average
Outperformers:
- +13.2% - Darktrace PLC (DARK.L)
- +9.1% - ITV PLC (ITV.L)
- +6.9% - Urban Logistics Reit PLC (SHED.L)
Underperformers:
- -2.5% - ASOS PLC (ASOS.L)
- -1.9% - Hargreaves Lansdown PLC (HRGV.L)
- -1.7% - HALEON PLC (HLN.L)
Economic events up next (Times in BST)
How to trade with City Index
You can easily trade with City Index by using these four easy steps:
- Open an account, or log in if you’re already a customer
• Open an account in the UK
• Open an account in Australia
• Open an account in Singapore
- Search for the company you want to trade in our award-winning platform
- Choose your position and size, and your stop and limit levels
- Place the trade
How to trade with FOREX.com
Follow these easy steps to start trading with FOREX.com today:
- Open a Forex.com account, or log in if you’re already a customer.
- Search for the pair you want to trade in our award-winning platform.
- Choose your position and size, and your stop and limit levels.
- Place the trade.
Related tags:


Open an account in minutes
Experience award-winning platforms with fast and secure execution.
Economic calendar
Web Trader platform
Our sophisticated web-based platform is packed with features.
Related articles
China's steel slump leaves iron ore bulls under the pump
Iron ore has broken major support, threatening a return to the lows of 2022 as mounting evidence of weakness in China's steel sector reinforces the bearish outlook.

NZD/USD Forecast: Kiwi faces historic breakdown as RBNZ survey looms
NZD/USD is teetering above support that held through the pandemic and Liberation Day turmoil. With RBNZ hawks repeatedly disappointed, today's inflation expectations survey could open the door to a slide towards the GFC lows.

USD/JPY, AUD/JPY: Central Bank Divergence Creates Two-Way Risk
USD/JPY eyes a breakout above 160, while AUD/JPY faces further losses as Fed, RBA and BoJ interest rate expectations diverge.
StoneX Financial Ltd (trading as "FOREX.com") is an execution-only service provider. This material, whether or not it states any opinions, is for general information purposes only and it does not take into account your personal circumstances or objectives. This material has been prepared using the thoughts and opinions of the author and these may change. However, FOREX.com does not plan to provide further updates to any material once published and it is not under any obligation to keep this material up to date.
This material is short term in nature and may only relate to facts and circumstances existing at a specific time or day. Nothing in this material is (or should be considered to be) financial, investment, legal, tax or other advice and no reliance should be placed on it. No opinion given in this material constitutes a recommendation by FOREX.com or the author that any particular investment, security, transaction or investment strategy is suitable for any specific person.
The material has not been prepared in accordance with legal requirements designed to promote the independence of investment research. Although FOREX.com is not specifically prevented from dealing before providing this material, FOREX.com does not seek to take advantage of the material prior to its dissemination. This material is not intended for distribution to, or use by, any person in any country or jurisdiction where such distribution or use would be contrary to local law or regulation. For further details see our full non-independent research disclaimer and quarterly summary.