




Featured Trade Nasdaq 100 bullish breakout from range
Nasdaq 100 sees further potential upside ahead of Fed FOMC.
Share this:

Short-term technical outlook on Nasdaq 100/US Tech 100 (Tues 18 Jun)
click to enlarge charts
Key technical elements
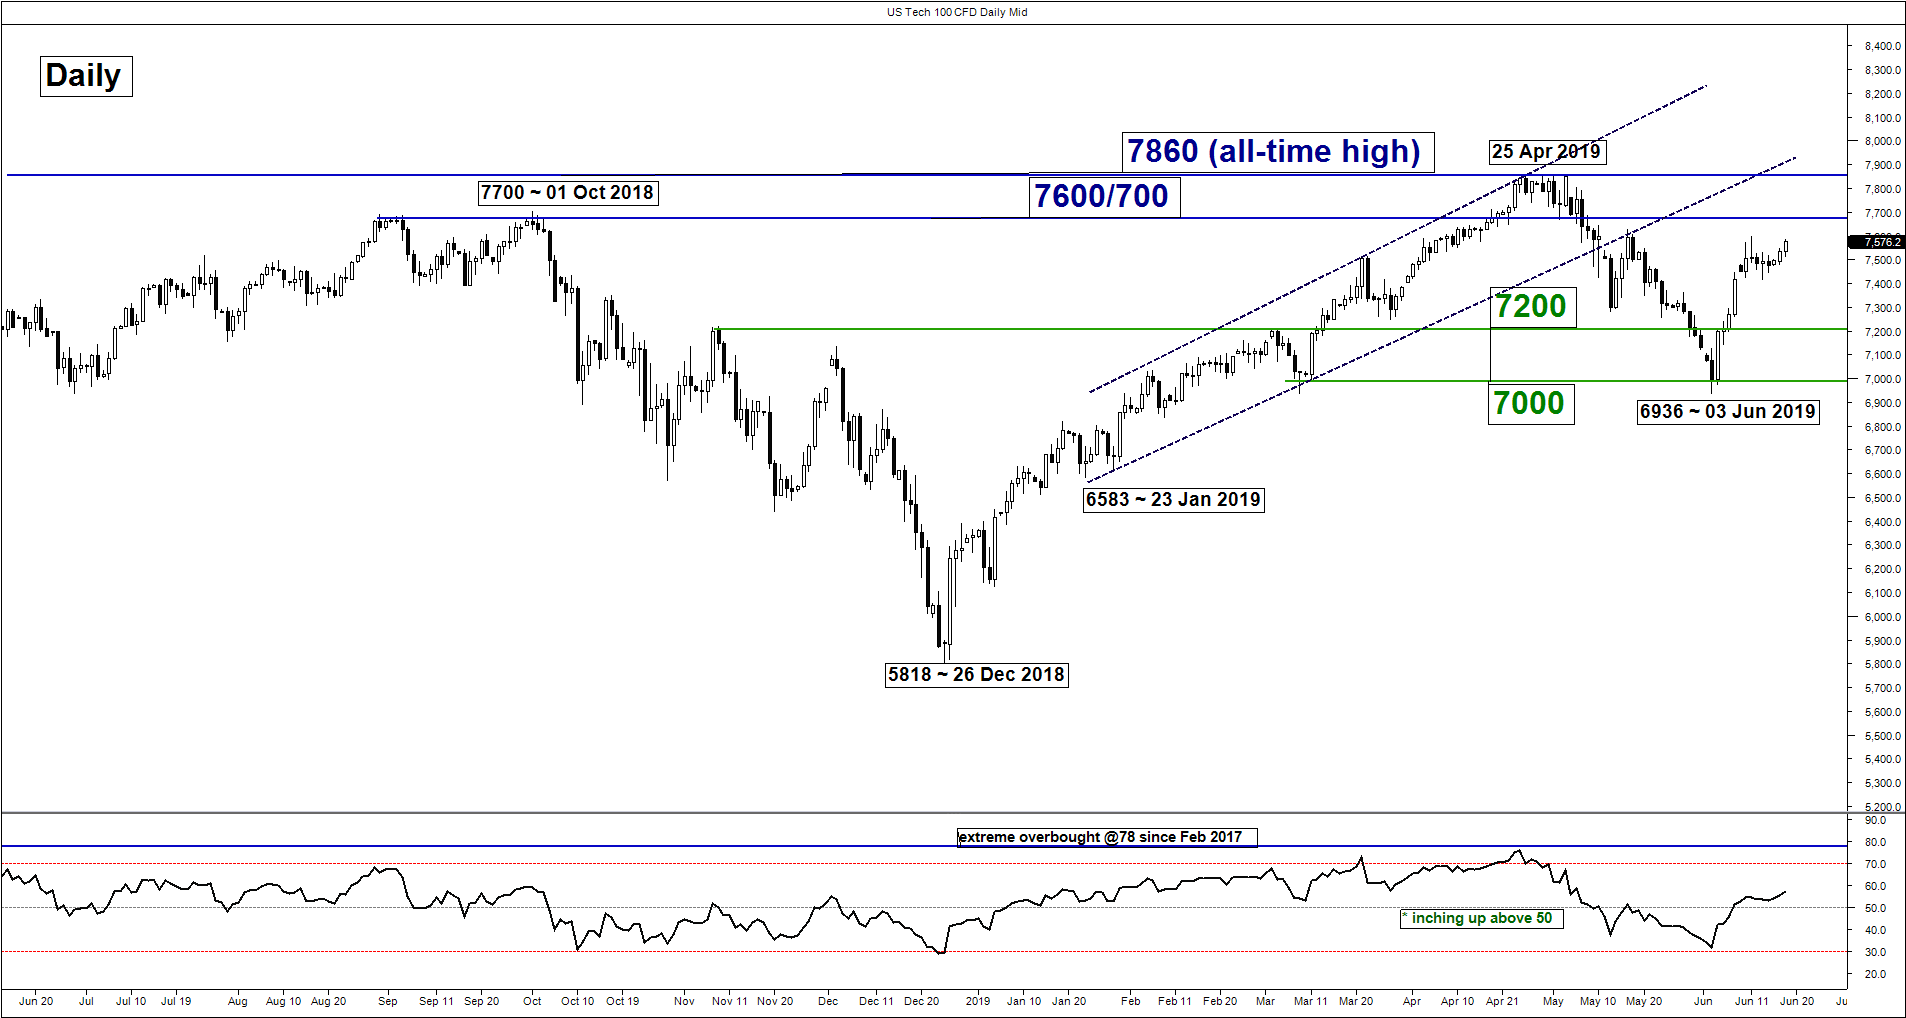
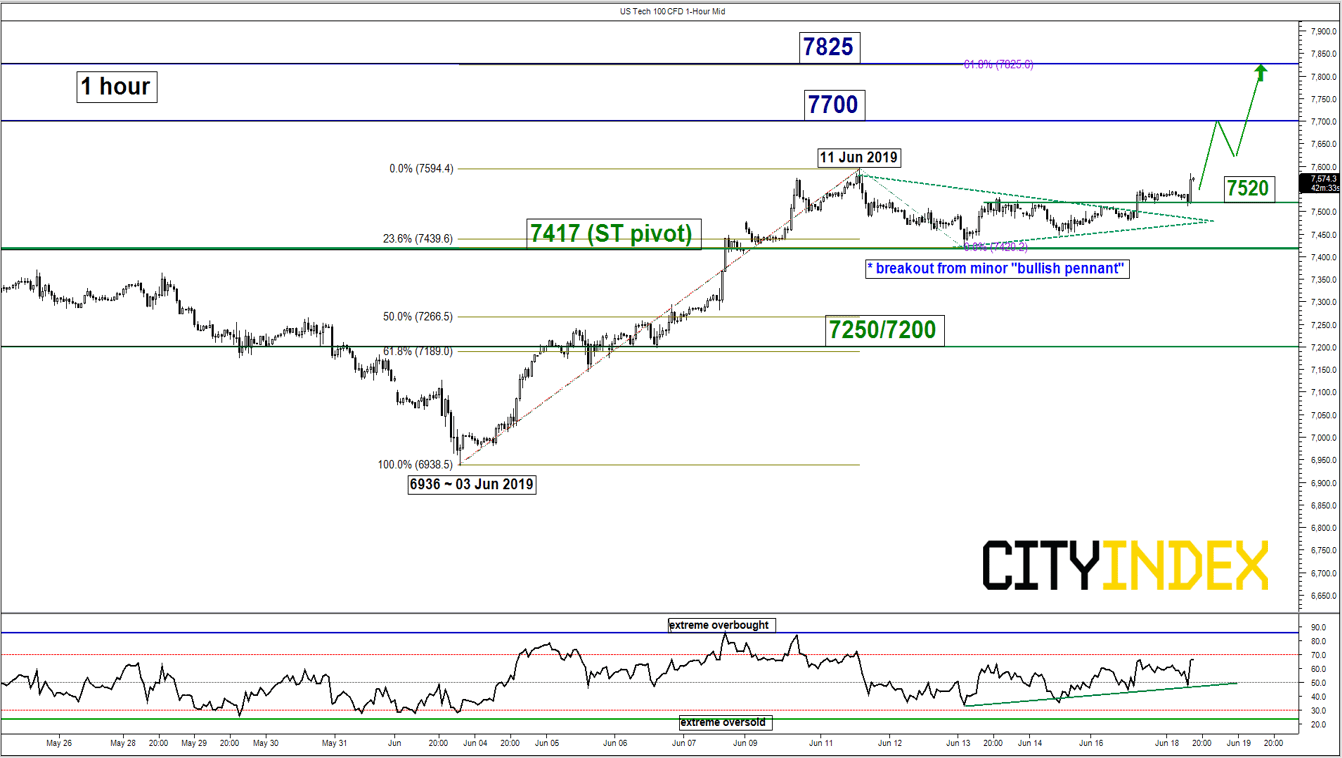
- Since our previous “Featured Trade” report published on the US Tech 100 Index (proxy for the Nasdaq 100 futures) on last Tues, 12 Jun, the Index has staged the expected minor corrective pull-back/decline to print a low of 7417 on 13 June but fell short of our target/support of 7350. Click here for a recap.
- Momentum from short to medium-term has turned positive as indicated by both the daily and hourly RSI oscillators.
- In today’s European session, the Index has shaped a breakout from its minor “bullish pennant” contracting range configuration which has been reinforced by a dovish speech from ECB President Draghi in an ECB forum in Portugal. Draghi has emphasised that ECB has the available tools and the willingness to cut interest rates again or provide another round of QE if inflation does not reach ECB’s intended target.
- Thus, it is likely that the Index has ended the minor corrective pull-back and it is shaping another potential impulsive upleg sequence within its medium-term uptrend in place since 03 Jun 2019 low of 6936.
Key Levels (1 to 3 days)
Intermediate support: 7250
Pivot (key support): 7417
Resistances: 7700 & 7825 (Fibonacci expansion)
Next support: 7250/7200
Conclusion
If the 7250 key short-term medium-term pivotal support holds, the Index is likely to shape another potential upleg to target the next resistances at 7700 (30 Aug/01 Oct 2018 swing highs) and 7825 next in the first step.
On the other hand, a break with an hourly close below 7417 invalidates the bullish scenario for an extension of the minor corrective pull-back towards the key medium-term pivotal support zone of 7250/7200 (also the 50%/61.8% Fibonacci retracement of the recent rally from 03 Jun 2019 low to 11 Jun 2019 high).
Short-term technical outlook on Nasdaq 100/US Tech 100 (Tues 18 Jun)
click to enlarge charts
Key technical elements
- Since our previous “Featured Trade” report published on the US Tech 100 Index (proxy for the Nasdaq 100 futures) on last Tues, 12 Jun, the Index has staged the expected minor corrective pull-back/decline to print a low of 7417 on 13 June but fell short of our target/support of 7350. Click here for a recap.
- Momentum from short to medium-term has turned positive as indicated by both the daily and hourly RSI oscillators.
- In today’s European session, the Index has shaped a breakout from its minor “bullish pennant” contracting range configuration which has been reinforced by a dovish speech from ECB President Draghi in an ECB forum in Portugal. Draghi has emphasised that ECB has the available tools and the willingness to cut interest rates again or provide another round of QE if inflation does not reach ECB’s intended target.
- Thus, it is likely that the Index has ended the minor corrective pull-back and it is shaping another potential impulsive upleg sequence within its medium-term uptrend in place since 03 Jun 2019 low of 6936.
Key Levels (1 to 3 days)
Intermediate support: 7250
Pivot (key support): 7417
Resistances: 7700 & 7825 (Fibonacci expansion)
Next support: 7250/7200
Conclusion
If the 7250 key short-term medium-term pivotal support holds, the Index is likely to shape another potential upleg to target the next resistances at 7700 (30 Aug/01 Oct 2018 swing highs) and 7825 next in the first step.
On the other hand, a break with an hourly close below 7417 invalidates the bullish scenario for an extension of the minor corrective pull-back towards the key medium-term pivotal support zone of 7250/7200 (also the 50%/61.8% Fibonacci retracement of the recent rally from 03 Jun 2019 low to 11 Jun 2019 high).
Charts are from City Index Advantage TraderPro
Related tags:
Latest market news




Open an account in minutes
Experience award-winning platforms with fast and secure execution.
Economic calendar
Web Trader platform
Our sophisticated web-based platform is packed with features.
Related articles

Nikkei swings harder than Nasdaq as AI fears deepen
Nikkei 225 volatility is running well ahead of Nasdaq 100, with the index construction and Japan's heavy exposure to AI manufacturing potentially explaining the difference.

S&P 500, Nasdaq 100 Claw Back But NVDA Cloud Looms Overhead
Last week was green for both the Nasdaq and S&P 500 but given the sell-off that led into that bounce there’s still a very real question as to whether bears still have a statement to make. And the NVDA situation presents a very real threat.


Nasdaq 100 forecast: Nvidia troubles put AI recovery into question
The recovery for major indices this week has helped repair much of the technical damage inflicted by last week’s sell-off, but the latest developments with Nvidia suggest investors are not quite ready to put the underlying risks behind them. The Nasdaq 100 led other US index futures lower overnight, with falls of around 0.8%.

StoneX Financial Ltd (trading as "FOREX.com") is an execution-only service provider. This material, whether or not it states any opinions, is for general information purposes only and it does not take into account your personal circumstances or objectives. This material has been prepared using the thoughts and opinions of the author and these may change. However, FOREX.com does not plan to provide further updates to any material once published and it is not under any obligation to keep this material up to date.
This material is short term in nature and may only relate to facts and circumstances existing at a specific time or day. Nothing in this material is (or should be considered to be) financial, investment, legal, tax or other advice and no reliance should be placed on it. No opinion given in this material constitutes a recommendation by FOREX.com or the author that any particular investment, security, transaction or investment strategy is suitable for any specific person.
The material has not been prepared in accordance with legal requirements designed to promote the independence of investment research. Although FOREX.com is not specifically prevented from dealing before providing this material, FOREX.com does not seek to take advantage of the material prior to its dissemination. This material is not intended for distribution to, or use by, any person in any country or jurisdiction where such distribution or use would be contrary to local law or regulation. For further details see our full non-independent research disclaimer and quarterly summary.