



GBP/AUD Slumps to 13-Year Low as RBA–BoE Divergence Widens
GBP/AUD hits a 13-year low as RBA hawkishness and BoE easing expectations drive policy divergence and sterling weakness.
Share this:

GBP/AUD has plunged to a 13-year low as widening monetary policy divergence between the Reserve Bank of Australia (RBA) and the Bank of England (BoE) combines with rising UK political uncertainty.
The cross is on track for its worst monthly performance since September 2023, with bearish momentum accelerating as traders position for further divergence in rates and growth expectations. With technical levels breaking across multiple timeframes, the focus now shifts to how much further the downside could extend.
View related analysis:
View related analysis:
GBP/AUD Slumps to 13-Year Low on RBA–BoE Policy Divergence
Diverging RBA and BoE Policy, Political Risk Weigh on GBP/AUD
We’re not even halfway through a short month, and GBP/AUD is close to surpassing January as the worst month for the pair since September 2023. Traders have been handed the kind of divergent theme FX markets thrive on: a classic mix of diverging monetary policy expectations and mounting political uncertainty.
- The Reserve Bank of Australia (RBA) delivered a hawkish 25bp hike. While the move itself was widely expected, the tone of the statement and upgraded forecasts provided the real upside surprise for Australian dollar bulls.
- The Bank of England (BoE) held rates as expected, but the vote split was far tighter than the anticipated 7–2 in favour of a hold. Instead, five MPC members voted to hold and four to cut. The Bank also signalled that further rate reductions are likely.
- On the political front, UK PM Keir Starmer is under pressure amid fallout linked to the Epstein files. While not directly implicated, scrutiny around his decision to appoint Mandelson — and whether he was aware of prior controversies — has raised questions over judgement and governance. Even without concrete findings, political uncertainty is adding to sterling’s headwinds.
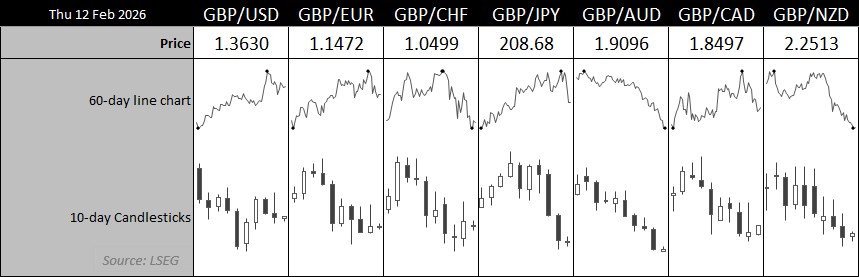
Source: LSEG
GBP/AUD Hits 13-Year Low as Bearish Momentum Accelerates
This ideal mix of bearish drivers for GBP/AUD has pushed the cross to a 156-month low, with momentum clearly accelerating. The key question now is how much further it can fall.
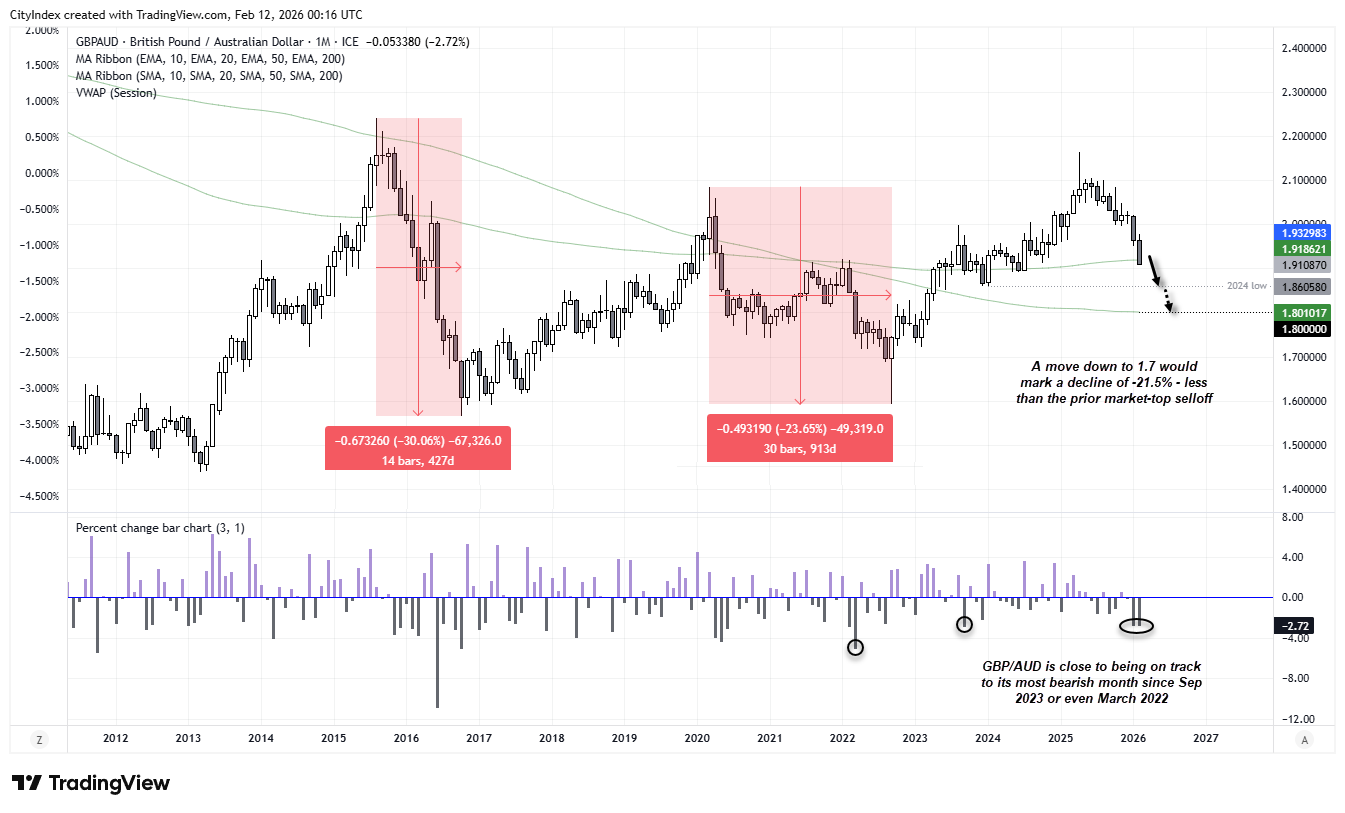
If history is any guide, there may still be room to the downside. GBP/AUD has declined just 11.7% from its recent peak — less than half the magnitude of the previous two major tops.
- March 2020 – September 2022: -23.7%
- August 2015 – October 2016: -30.1%
- April 2025 – Present: -11.7%
In other words, the current drawdown remains modest relative to prior cyclical declines, which suggests the move could extend further if the macro and political divergence persists.
Source: TradingView / ICE
GBP/AUD Tests 200-Month EMA as Bears Eye 1.80 Handle
The monthly chart shows GBP/AUD testing a break below its 200-month EMA (1.9186). While that could spark a near-term bounce, momentum suggests bears are targeting the 2024 low at 1.8605, or potentially the 200-month SMA near the 1.80 handle.
For context, a move down to 1.80 would amount to a 16.8% decline from the recent high. Even a drop to 1.70 would still fall short of the previous major market-top selloff of 23.7%.


GBP/AUD Technical Analysis: British Pound vs Australian Dollar
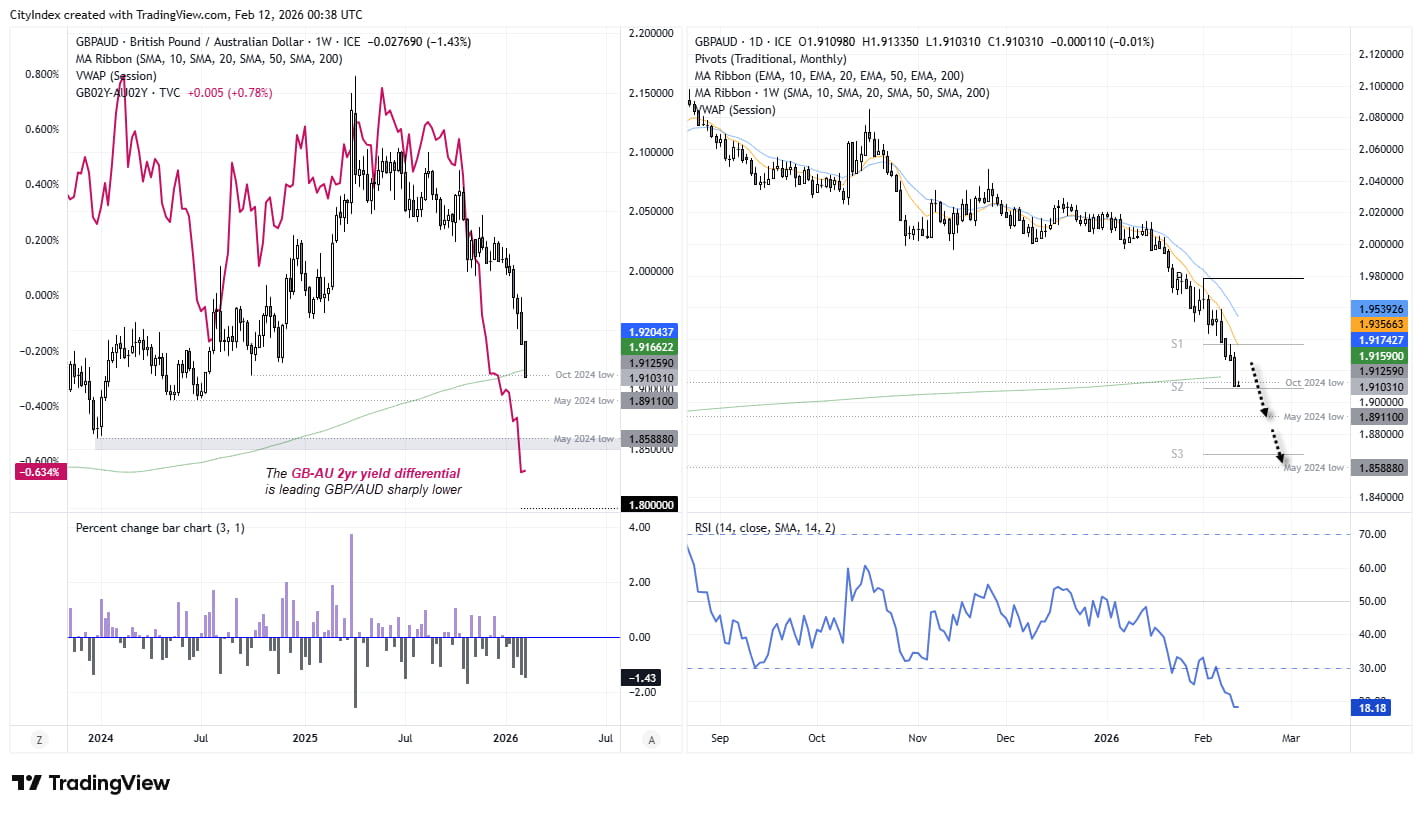
The cross has now broken below its 200-week SMA — a technically significant level. With price hovering around the October 2024 low, bears should be alert to the risk of near-term two-way volatility before the broader downtrend potentially resumes.
On the daily chart, price is stretched well below the 10- and 20-day EMAs, while RSI (14) is deeply oversold. These are not precise timing tools, but they do flag the risk of interim mean reversion.
That said, with UK political uncertainty and BoE easing expectations weighing on sterling — and RBA policy expectations underpinning the Australian dollar — GBP/AUD remains a cross to keep on bearish watchlists unless a material catalyst emerges to reverse the trend. The GB–AU 2-year yield differential continues to lead the move lower.
Source: TradingView / ICE
View the full economic calendar
View the full economic calendar
-- Written by Matt Simpson
Follow Matt on Twitter @cLeverEdge
How to trade with City Index
You can trade with City Index by following these four easy steps:
- Open an account, or log in if you’re already a customer
• Open an account in the UK
• Open an account in Australia
• Open an account in Singapore
- Search for the market you want to trade in our award-winning platform
- Choose your position and size, and your stop and limit levels
- Place the trade
Related tags:


Open an account in minutes
Experience award-winning platforms with fast and secure execution.
Economic calendar
Web Trader platform
Our sophisticated web-based platform is packed with features.
Related articles
China's steel slump leaves iron ore bulls under the pump
Iron ore has broken major support, threatening a return to the lows of 2022 as mounting evidence of weakness in China's steel sector reinforces the bearish outlook.

NZD/USD Forecast: Kiwi faces historic breakdown as RBNZ survey looms
NZD/USD is teetering above support that held through the pandemic and Liberation Day turmoil. With RBNZ hawks repeatedly disappointed, today's inflation expectations survey could open the door to a slide towards the GFC lows.

USD/JPY, AUD/JPY: Central Bank Divergence Creates Two-Way Risk
USD/JPY eyes a breakout above 160, while AUD/JPY faces further losses as Fed, RBA and BoJ interest rate expectations diverge.
StoneX Financial Ltd (trading as "FOREX.com") is an execution-only service provider. This material, whether or not it states any opinions, is for general information purposes only and it does not take into account your personal circumstances or objectives. This material has been prepared using the thoughts and opinions of the author and these may change. However, FOREX.com does not plan to provide further updates to any material once published and it is not under any obligation to keep this material up to date.
This material is short term in nature and may only relate to facts and circumstances existing at a specific time or day. Nothing in this material is (or should be considered to be) financial, investment, legal, tax or other advice and no reliance should be placed on it. No opinion given in this material constitutes a recommendation by FOREX.com or the author that any particular investment, security, transaction or investment strategy is suitable for any specific person.
The material has not been prepared in accordance with legal requirements designed to promote the independence of investment research. Although FOREX.com is not specifically prevented from dealing before providing this material, FOREX.com does not seek to take advantage of the material prior to its dissemination. This material is not intended for distribution to, or use by, any person in any country or jurisdiction where such distribution or use would be contrary to local law or regulation. For further details see our full non-independent research disclaimer and quarterly summary.