



Gold Outlook: Peace Hopes Support Gold, Options Market Signals Caution
Gold is attempting to carve out a swing low as peace deal hopes pressure the US dollar, but options traders remain wary of downside risks.
Share this:

Gold is attempting to form a near-term base, with technical signals on the daily chart turning increasingly constructive. However, options traders remain cautious, with demand for downside protection rising and implied volatility beginning to lift from recent lows. The next move may hinge on whether markets continue to price in hopes of a peace deal between the US and Iran.
View related analysis:
View related analysis:
Gold Bulls Eye Swing Low as US-Iran Peace Hopes Weigh on the Dollar
The latest hopes of a peace deal between the US and Iran weighed on the US dollar on Thursday, helping gold carve out what could become a swing low. But how many times can markets watch the same story unfold and expect a different ending? Ultimately, any meaningful breakthrough requires official and public agreement from the US, Iran and Israel—a hurdle that still appears some way off.
That said, optimism surrounding a potential peace deal could continue to support gold while those expectations remain intact. The obvious risk is that this proves to be yet another false alarm, triggering a reversal lower. With Friday marking the final trading day of the month, price action could also become increasingly fickle as positions are adjusted.
Still, if markets continue to price in a resolution—or, somehow, one actually materialises—the technical signals on gold's daily chart are difficult to ignore. The recent price action has the makings of a textbook swing low. Whether gold can extend its rebound from here may ultimately depend on the progress of negotiations.
This content was created by an affiliate of FOREX.com and represents the views and opinions of the author/speakers, not the views and opinions of FOREX.com, StoneX Group Inc., or its subsidiaries. The content has not been independently reviewed by FOREX.com.
Gold Futures (GC) Technical Analysis
The daily gold futures chart shows a false downside break of both the 200-day SMA and 200-day EMA. These are significant levels that are often difficult to crack, and the daily close back above them is constructive for bulls over the near term. Also note the false break beneath the March low. Prices have since reclaimed the monthly pivot point, while a bullish divergence is forming on RSI (2), further supporting the case for a near-term rebound.
The 1-hour chart shows that the strong rebound was accompanied by elevated volumes, suggesting bulls drove prices higher rather than the move being merely a short-covering exercise. However, resistance emerged at a weekly VPOC (volume point of control), and prices are retreating during early Asian trade.
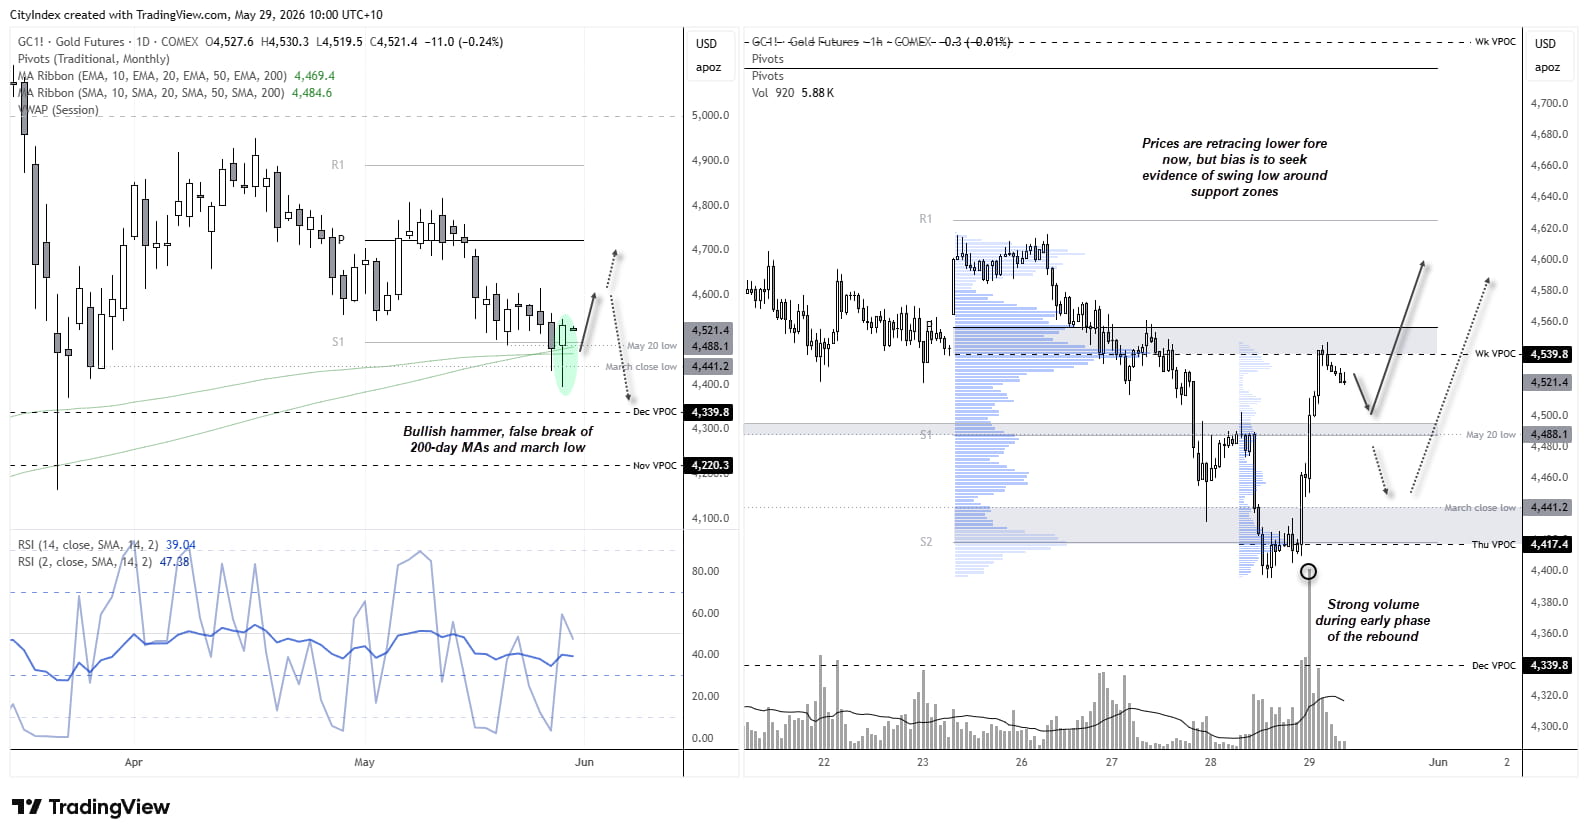
Source: COMEX, CME, TradingView


Gold Options Market Signals Caution Despite Bullish Price Action
Options traders appear less convinced by gold's recent rebound, with signs of increased demand for downside protection in the options market.
Despite the bullish hammer formed on the daily chart, the 1-week 10-delta risk reversal—a proxy for tail risk—fell to a four-week low, signalling increased demand for puts relative to calls. Similar shifts were also evident among institutional traders across longer-dated maturities.
Perhaps the rise in put demand reflects portfolio managers taking a more defensive stance into month-end, when price action can often become fickle. However, the fact that this trend is evident across all major gold risk reversals suggests there may be more at play than simple month-end positioning flows.
It is also worth noting that implied volatility for one-week and one-month spot gold options has started to curl higher from relatively subdued levels. Given volatility tends to be cyclical, the recent uptick may be an early sign that traders are preparing for a larger move in either direction.
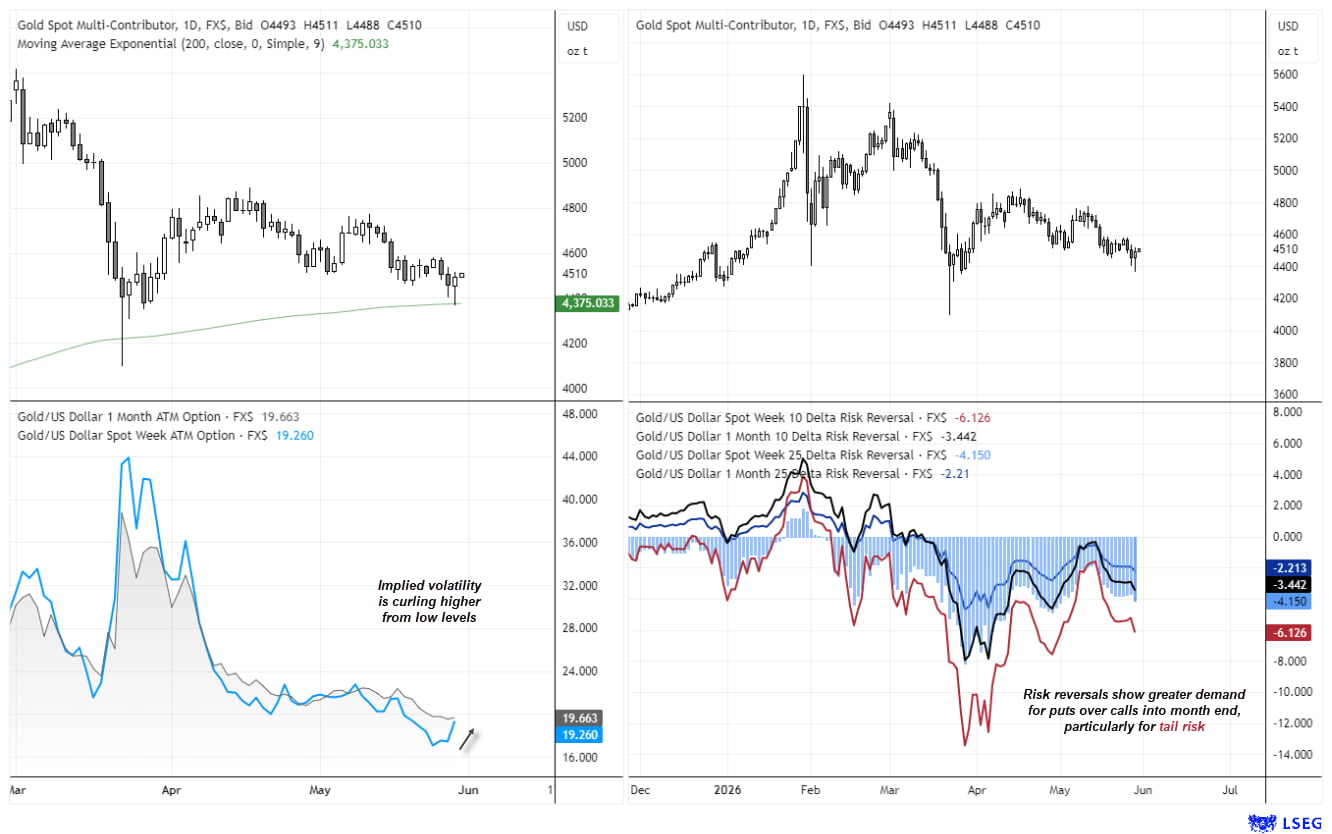
Source: COMEX, CME, LSEG
View the full economic calendar
View the full economic calendar
-- Written by Matt Simpson
Follow Matt on Twitter @cLeverEdge
How to trade with City Index
You can trade with City Index by following these four easy steps:
- Open an account, or log in if you’re already a customer
• Open an account in the UK
• Open an account in Australia
• Open an account in Singapore
- Search for the market you want to trade in our award-winning platform
- Choose your position and size, and your stop and limit levels
- Place the trade
Related tags:


Open an account in minutes
Experience award-winning platforms with fast and secure execution.
Economic calendar
Web Trader platform
Our sophisticated web-based platform is packed with features.
Related articles
China's steel slump leaves iron ore bulls under the pump
Iron ore has broken major support, threatening a return to the lows of 2022 as mounting evidence of weakness in China's steel sector reinforces the bearish outlook.

USD/JPY, AUD/JPY: Central Bank Divergence Creates Two-Way Risk
USD/JPY eyes a breakout above 160, while AUD/JPY faces further losses as Fed, RBA and BoJ interest rate expectations diverge.

DXY, GBP/USD, AUD/USD, USD/CAD, USD/JPY, Gold Weekly Technical Outlook 11 16 2026
Sr. Technical Strategist Michael Boutros highlights the levels that matter on the USD Majors, commodities, and equity indices charts this week.

StoneX Financial Ltd (trading as "FOREX.com") is an execution-only service provider. This material, whether or not it states any opinions, is for general information purposes only and it does not take into account your personal circumstances or objectives. This material has been prepared using the thoughts and opinions of the author and these may change. However, FOREX.com does not plan to provide further updates to any material once published and it is not under any obligation to keep this material up to date.
This material is short term in nature and may only relate to facts and circumstances existing at a specific time or day. Nothing in this material is (or should be considered to be) financial, investment, legal, tax or other advice and no reliance should be placed on it. No opinion given in this material constitutes a recommendation by FOREX.com or the author that any particular investment, security, transaction or investment strategy is suitable for any specific person.
The material has not been prepared in accordance with legal requirements designed to promote the independence of investment research. Although FOREX.com is not specifically prevented from dealing before providing this material, FOREX.com does not seek to take advantage of the material prior to its dissemination. This material is not intended for distribution to, or use by, any person in any country or jurisdiction where such distribution or use would be contrary to local law or regulation. For further details see our full non-independent research disclaimer and quarterly summary.